Uniswap (UNI) Price Prediction: Headwinds Continue to Drive the UNI/USDT Market
Estimated Reading Time: 2 minutes
Don’t invest unless you’re prepared to lose all the money you invest. This is a high-risk investment and you are unlikely to be protected if something goes wrong. Take 2 minutes to learn more

Date: December 18, 2025
The Uniswap market seems yet to find a base of support. Price action in the Uniswap market continues to fall toward lower price levels. Even the ongoing session stays aligned for more bearish retracement.
UNI/USDT Long-Term Trend—Bearish (Daily Chart)
Key Price Levels
Resistance: $5.00, $5.50, $6.00
Support: $4.50, $4.00, $3.50
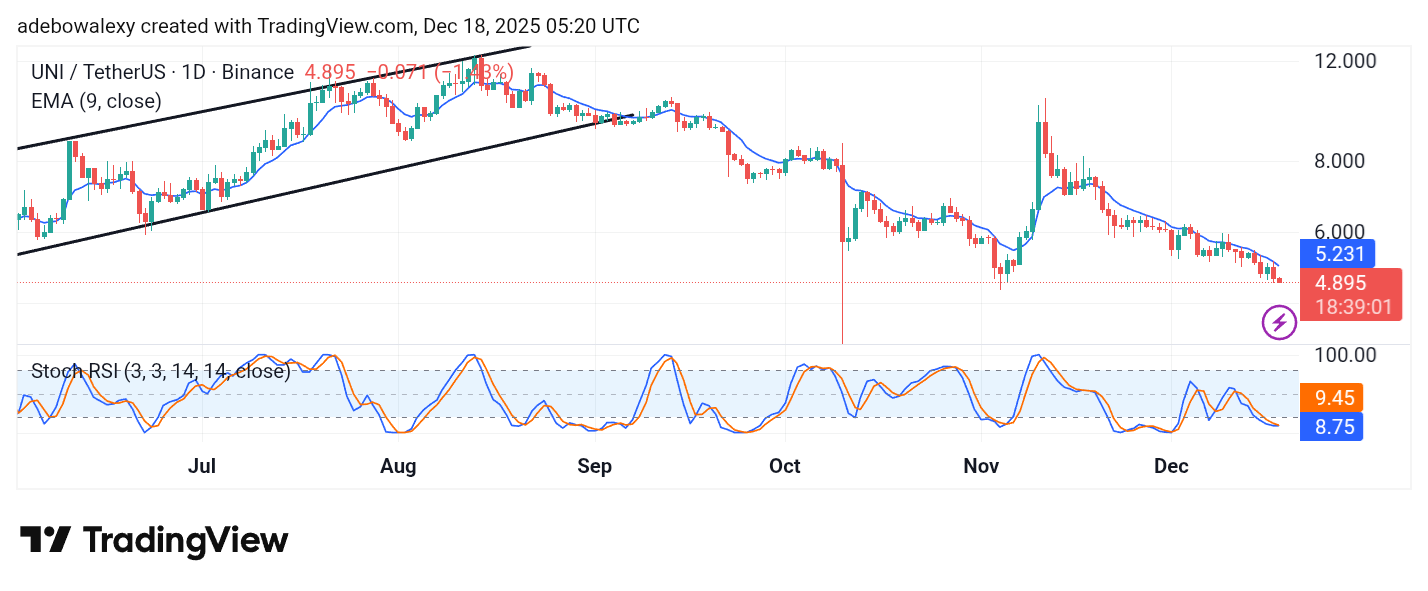
The Uniswap market can be seen going straight south since the market last tested the $10 price mark in November. The ongoing session can be seen appearing modestly below the 9-day Exponential Moving Average (EMA) line. Meanwhile, the Stochastic Relative Strength Index (SRSI) indicator lines can be seen to have reached the depths of the oversold region, and the lines of the indicator can be seen converging as if preparing for a bullish crossover.
Uniswap Price Prediction: UNI/USDT Seems to Be Eyeing a Rebound
Although the Uniswap market remains under the influence of headwinds, it appears something may be brewing. While the ongoing session stays bearish, the size of the corresponding price compared to the one for the previous session hints at decreasing bearish momentum.
Meanwhile, the SRSI indicator lines are now converged in the oversold region for an upside crossover. Therefore, although the market is still heading south, it appears a bounce may soon occur in this market.
Uniswap Price Prediction: UNI/USDT Bears Try to Stay Relevant (4-Hour Chart)
On the Uniswap 4-hour market, it is evident that price action remains under bearish influences. However, it appears that over the past three sessions, this market hasn’t exceeded a particular support level.
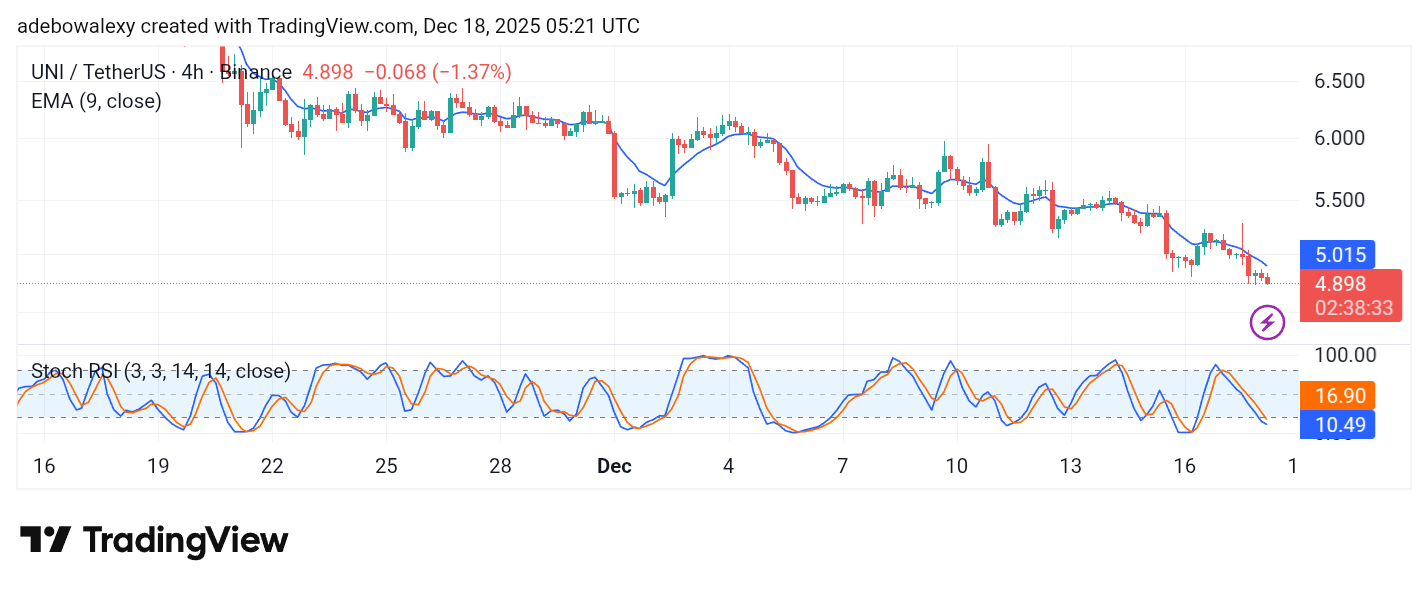
This is so despite the fact that the ongoing session has presented modest bearish activity. The last price candle here as well stands below the 9-day EMA curve. The SRSI indicator lines have descended into the oversold region, and the lines here appear to have only a slight deflection toward a crossover. Therefore, this market may still descend toward the $4.70 or $4.50 price level.