Cardano (ADA/USDT) Eyes Potential Bullish Breakout Amidst Bearish Pressure
Estimated Reading Time: 3 minutes
Don’t invest unless you’re prepared to lose all the money you invest. This is a high-risk investment and you are unlikely to be protected if something goes wrong. Take 2 minutes to learn more
Cardano Long-term Analysis: Ranging
The market for Cardano against the Tether over an extended period of time has been bearish despite efforts to break through key upper limits. However, current price movement suggests a possible breakout scenario as the bulls attempt to put an end to the bearish reign.
Cardano in recent times has shown resilience after a prolonged downtrend, bouncing from lower support levels despite facing a strong rejection above the $1.000 level. However, despite the bearish activities, current price actions suggest price accumulation, as the Stochastic RSI indicates a potential upside movement.
Right now, Cardano trades at $0.6594, recording over 500 million traded volumes for the week.
Technical Indicators
Major Resistance Levels: $0.7252, $0.8917, and $1.0000
Major Support Levels: $0.6003, $0.5078, and $0.4500
Cardano Technical Analysis
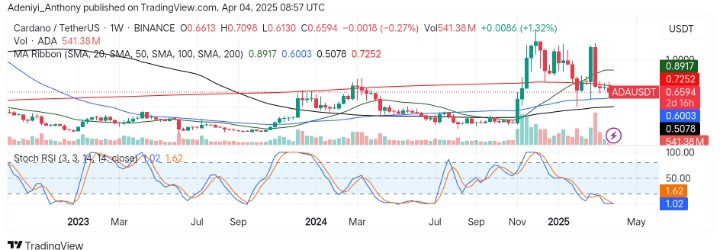
The analysis of the Cardano against the Tether on a weekly timeframe shows the pair has been maintaining a position above the $0.6000 level, with the 50 and 100 simple moving averages acting as strong support. However, with the 20 SMA improving to the north, increasing volume suggests that the price might break above the 200 SMA at $0.7252, a point that highlights long-term bearish actions.
On the other hand, the Stochastic oscillator indicates a highly oversold condition as the lines operate beneath the 5-mark level. To this end, an improvement above the 15-mark would confirm a bullish breakout, but for now, the price might oscillate at the current level.
ADA/USDT Analysis: What’s Happening Here?
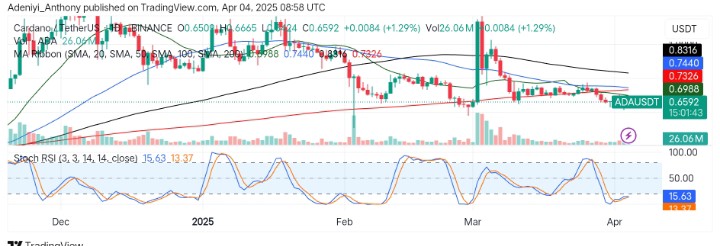
On the daily chart, ADA/USDT seems to be stabilizing below key resistance, building momentum as a breakout above $0.6988 would lead to a test of further resistance levels if more bullish traders come in.
The oscillator beneath the chart, on the other hand, signals bullish momentum, and potential buying pressure is improving as the blue line hits above the 15-mark level.
To this end, ADA/USDT needs to sustain a move above the 20 SMA at $0.6988 for a confirmed breakout; otherwise, failure to hold above the current price might lead to a retest of lower supports.
You can purchase crypto coins here. Buy LBlock