Cardano (ADA/USDT) Prepares for a Bearish Crossover
Estimated Reading Time: 3 minutes
Don’t invest unless you’re prepared to lose all the money you invest. This is a high-risk investment and you are unlikely to be protected if something goes wrong. Take 2 minutes to learn more
Cardano Long-term Analysis: Bearish
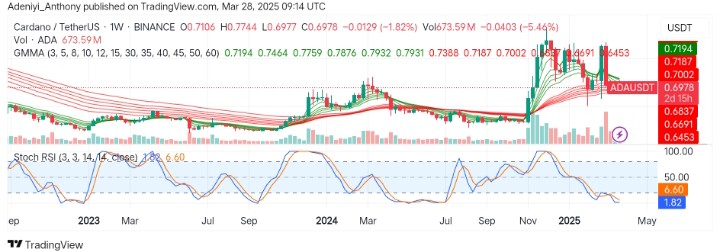
The market for Cardano against the Tether appears to be in a pullback phase after recent failed attempts by the bullish traders to push the pair’s price north. The previous candlestick formations suggest the bulls were in control. However, the short-term momentum appears weak as the Guppy Multiple Moving Averages (GMMAs) converge.
Recently, Cardano has been in a general uptrend, as seen in the divergence of the GMMAs set of EMAs. However, the pair’s price, which peaked around $0.7900, is now significantly down, recording 1.82% weekly losses.
To this end, the pair might see a further downtrend if short-term momentum remains weakened, and a move beyond $0.6837 may be unavoidable in the near term.
Currently, Cardano trades at $0.6978, with over 673 million traded volumes for the week.
Technical Indicators
Major Resistance Levels: $0.7194, $0.7464, and $0.7759
Major Support Levels: $0.6837, $0.6453, and $0.6000
Cardano Technical Analysis
The analysis of Cardano against the Tether shows the pair has been falling since hitting a local high. From the upper part of the chart, the GMMAs show the pair is set for further decline as the set of exponential moving averages compresses together.
On the other hand, the Stochastic RSI is currently low, indicating an oversold condition. This suggests a potential bounce or reversal in price if buyers step in.
To this end, if the pair’s price can hold above $0.7194 in the near term, a move beyond $0.7759 might materialize soon.
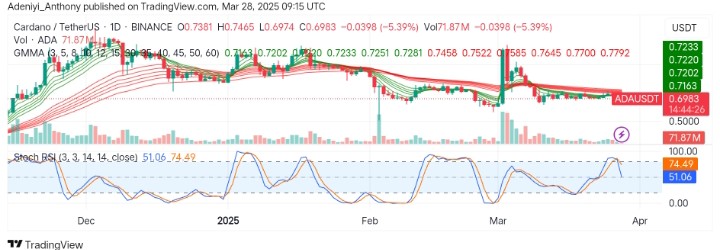
ADA/USDT Analysis: Will the Immediate Support Hold?
On the daily chart, ADA/USDT has gone down by over 5%, showing bearish pressure as the long-period EMAs appear to be over the short-period EMAs. Though the compression might be hinting at a possible reversal, a move above $0.7202 would confirm a reversal soon.
However, the Stochastic oscillator shows a mix of signals, as the lines are positioned at the overbought while pointing to the south. This suggests the pair might see some correction to the south before making another attempt at the north.
You can purchase crypto coins here. Buy LBlock


