POL (prev. MATIC) Price Prediction: POL/USDT Retains the Lead
Estimated Reading Time: 3 minutes
Don’t invest unless you’re prepared to lose all the money you invest. This is a high-risk investment and you are unlikely to be protected if something goes wrong. Take 2 minutes to learn more

Date: August 23, 2025
The POL (prev. MATIC) daily market has been sustained above the $0.2200 price level over the recent past. The previous session produced a notable upward rebound that elevated the market and drew dramatic bearish attention.
POL/USDT Long-Term Trend — Bullish (Daily Chart)
Key Price Levels:
Resistance: $0.2500, $0.3000, $0.3250
Support: $0.2300, $0.2000, $0.1900
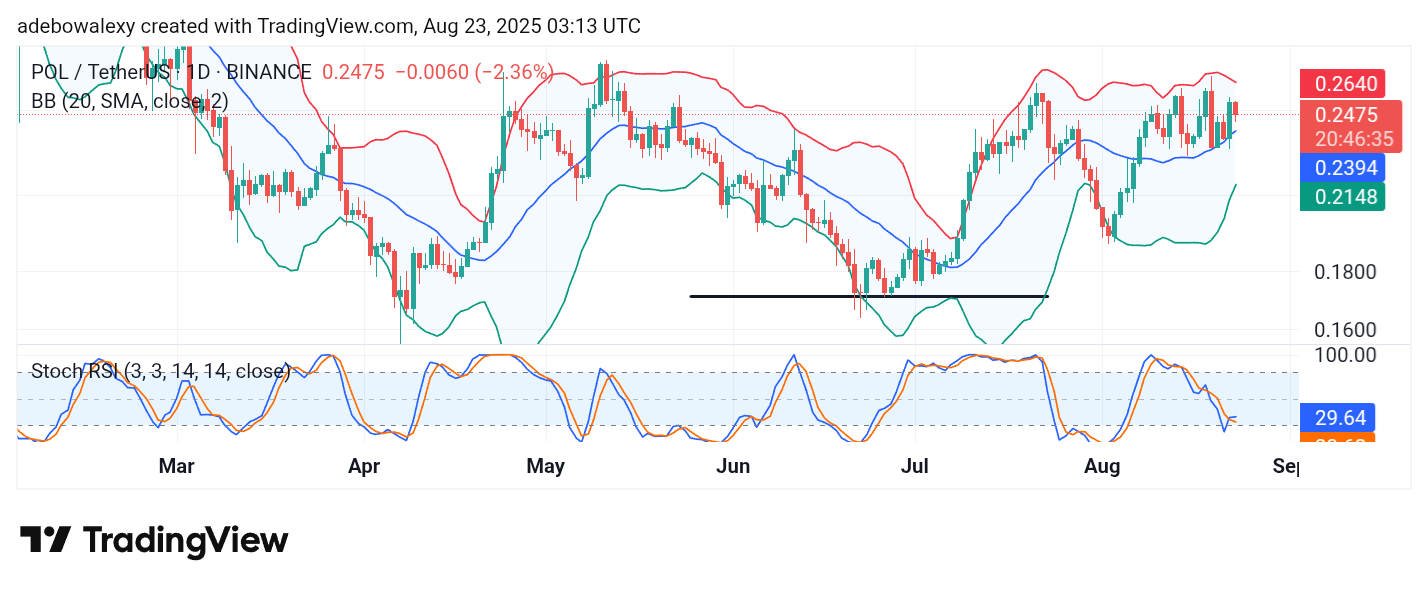
Bears in the POL (prev. MATIC) daily market are leading the session, going by the appearance of the last price candle on the chart. Albeit, the ongoing session stands just above the equilibrium level. Also, it could be noticed that the extreme limits of the BB indicator are contracting. Likewise, the Stochastic Relative Strength Index (SRSI) indicator lines recently delivered an upside crossover in the oversold region. However, ensuing lines of the indicator show a sideways trajectory due to the downward rebound of price action.
POL/USDT Price Prediction: POL (prev. MATIC) Upside Move Seems Preserved
Despite the ongoing pullback in the current session, it can be observed that price action may subsequently proceed in its upward trajectory. The last price candle here stands above the middle band of the BB indicator.
While this remains in place, the uppermost and lowest limits of the BB indicator are contracting toward the center. The SRSI indicator lines have a shaky appearance, suggesting that the upside rebound is threatened. Nevertheless, the market itself stays well positioned to subsequently resume rising.
POL/USDT Price Prediction: POL (prev. MATIC) Still Has a Pullback But Stays Afloat (4-Hour Chart)
The ongoing session in the POL (prev. MATIC) 4-hour chart can still be seen in the red. This downward rebound occurred off the uppermost band of the BB indicator. The BB indicator line maintains a general sideways trajectory.
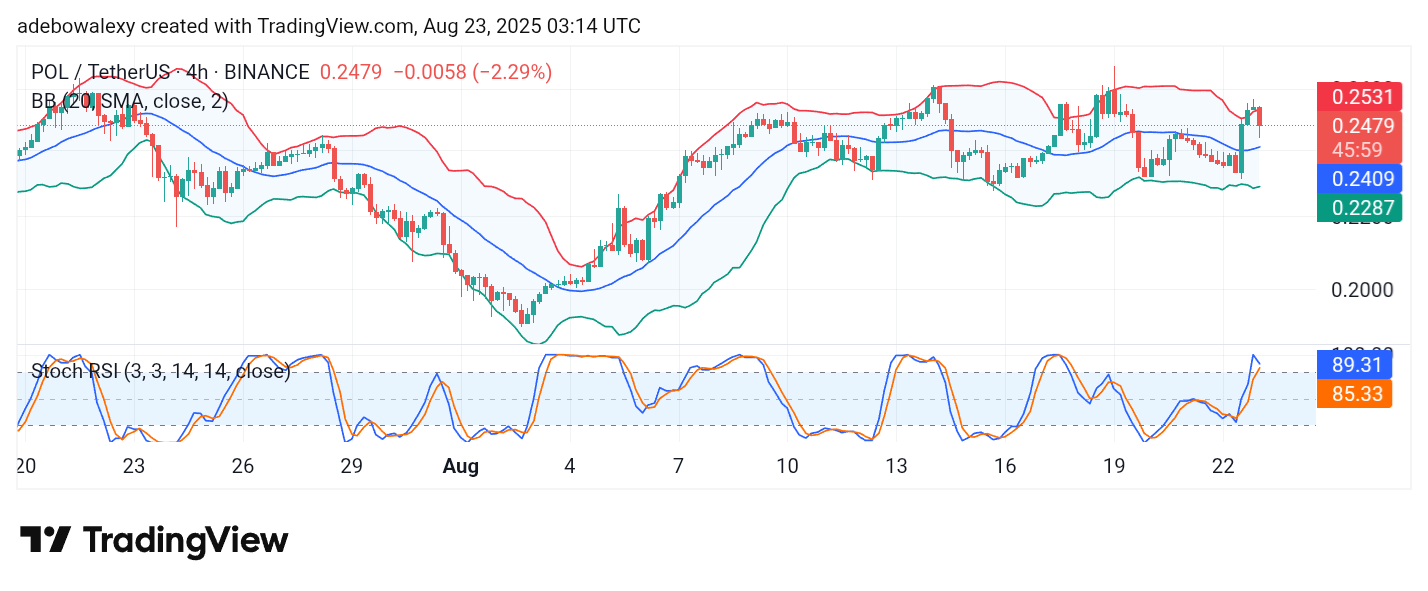
Meanwhile, the lines of the SRSI indicator, with the lead line showing a noticeable deflection toward a bearish crossover. Albeit, the lines of the SRSI are still some distance away from an actual bearish crossover. Likewise, price action remains well above the middle band of the BB indicator. Therefore, traders can still hold their ground as the market may push toward the $0.3000 mark soon.