Wall Street Memes (WSM) Market Is on, Nurturing Spikes
Estimated Reading Time: 3 minutes
Don’t invest unless you’re prepared to lose all the money you invest. This is a high-risk investment and you are unlikely to be protected if something goes wrong. Take 2 minutes to learn more
Wall Street Memes Price Prediction – March 11
The systemic structure of revalidating basis on the threshold of the lower trend line of the Bollinger Band is yet being carried out by bulls in the business deals that paired Wall Street Memes coin against the material valuation of the American fiat money, as the crypto-economic market is on, nurturing spikes in its input.
The bears’ ability to push the WSM/USD market further downward has been observed, with momentum gradually weakening, signaling that aggressive lows may not be reached anytime soon. Conversely, a lower horizontal line is drawn at the $0.0005 level, highlighting potential underlying support zones from the $0.001 point.
WSM/USD Market
Key Levels
Resistance levels: $0.002, $0.0025, $0.003
Support levels: $0.001, $0.0008, $0.0006
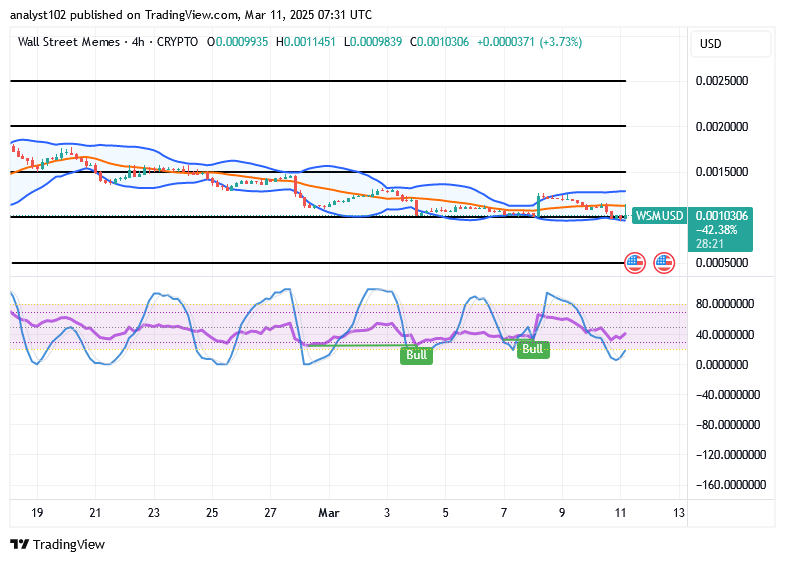
WSM/USD – 4-hour Chart
The medium-term chart (4-hour chart) of the WSM/USD trade is in the motion of garnering momentum, nurturing spikes.
As of this write-up, the Bollinger Bands indicators have stretched downward, touching the $0.001 line, with the upper band extending slightly below the $0.0015 resistance level. The stochastic oscillators have moved south into the oversold region, now attempting to cross back north as they position themselves between the 20 and 40 zones.
Will buyers of the WSM/USD market hold and solidify their position on the lower Bollinger Band threshold?
Buying and holding the positions on a long-term pattern is expected to continue irrespective of whether the WSM/USD market operations might yet witness a series of smaller declines potentially, given that the crypto-economic economy is on the threshold of building up catalysts, nurturing spikes.
Based on the current pattern setups of most indicators, the likelihood of continued WSM/USD market movements pushing steadily against the lower Bollinger Band trend line seems unlikely. Therefore, the market remains in a position accumulation phase, with trade formation still focused on gathering positions.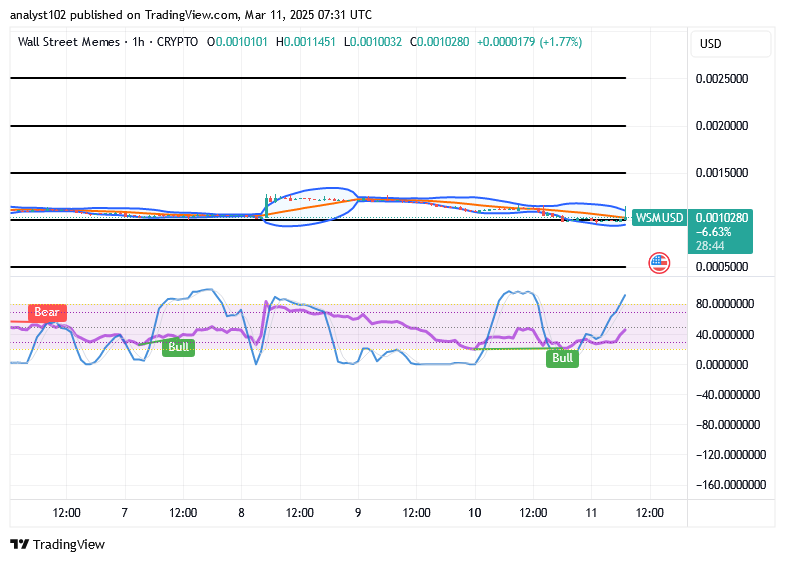
WSM/USD 1-hour chart
The 1-hour chart of the WSM/USD trade showcases that the crypto-economic market is on the basis of recouping energy, nurturing spikes in indexes.
The candlestick formation pattern is characterized by lower highs that exceed the lower lows, aligned with the trajectory of the Bollinger Bands’ trend lines. Meanwhile, the stochastic oscillators are gradually moving northbound, establishing a bullish signal on the baseline formation.
Examining my portfolio made me realize that I might actually have to attempt at work.
https://x.com/wallstmemes/status/1899147493855699286
Buy and stake WSM now!: Wall Street Meme (WSM)