Wall Street Memes (WSM) Trade Reshapes, Fine-Tuning Hikes
Estimated Reading Time: 3 minutes
Don’t invest unless you’re prepared to lose all the money you invest. This is a high-risk investment and you are unlikely to be protected if something goes wrong. Take 2 minutes to learn more
Wall Street Memes Price Prediction – March 10
Although the market operations of Wall Street Memes coin as being paired against the purchasing weight of the American currency have continually generated a rebuilding process at a given lower zone, just as the crypto-economic trade now reshapes basis, fine-tuning hikes in its signal inputs.
Over the past few sessions, the oscillators have remained in a holding pattern, suggesting a strong outlook for long-term position traders looking to capitalize on potential sudden bounce-backs. The $0.001 trade line now stands as a crucial support level, with bears unlikely to push past it sustainably, reinforcing the idea that holding the base instrument will not face further significant economic risks.
WSM/USD Market
Key Levels
Resistance levels: $0.002, $0.0025, $0.003
Support levels: $0.001, $0.0008, $0.0006
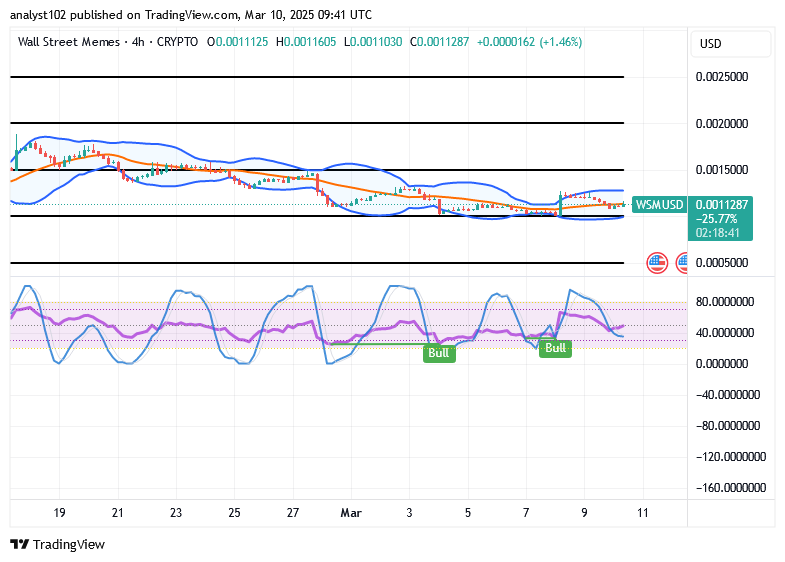
WSM/USD – 4-hour Chart
The medium-term chart (4-hour chart) of the WSM/USD market now shows that the crypto economy is reshaping its baseline, fine-tuning hikes in inputs.
The price movement pattern, characterized by varying candlesticks, suggests that a mild retracement is occurring. The Bollinger Bands indicators are exhibiting a more horizontal trajectory at the lower end, indicating a potential halt in the ongoing draw-downs and setting up the possibility of a rebound in the near future.
Has there been a trade signal cycle to denote that the WSM/USD market will, in the coming days, trade outside the bounds of the Bollinger Bands?
The situation so far has not been having a significant potency of seeing the WSM/USD market bargaining away from the boundaries of the Bollinger Bands indicators, as the crypto-economic trade currently reshapes its bottoms, fine-tuning hikes.
From the overall technical configuration of the indicators, it is evident that the prevailing downward forces are setting up solid opportunities for long entries. As such, maintaining long positions for the long term is crucial for capitalizing on potential appreciation of the base market, even if the counter instrument experiences a decline in value in the interim.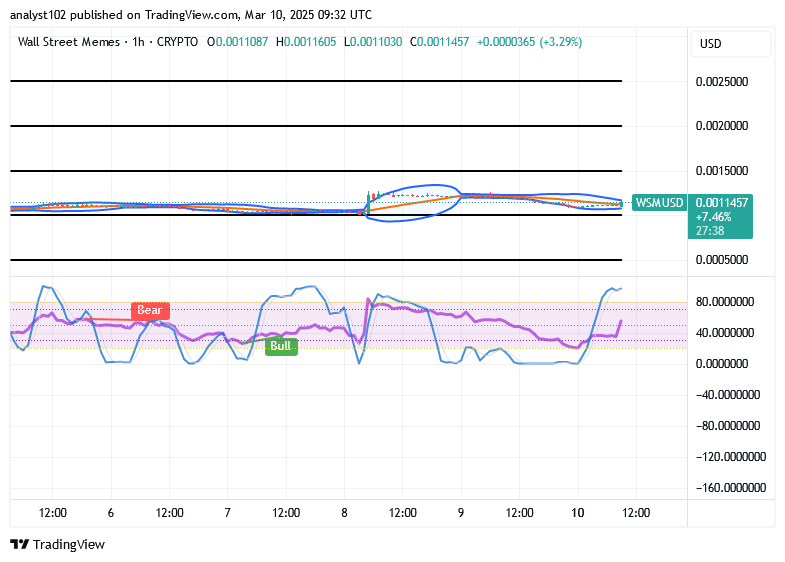
WSM/USD 1-hour chart
The 1-hour chart from the technical arrangements of the WSM/USD trade shows that the price reshapes, fine-tuning hikes.
The positioning of the Bollinger Bands, remaining above the $0.001 mark, suggests that buyers are actively working to minimize further losses in the current market operations. The steady bullish momentum indicated by the stochastic oscillators’ signals that buying pressure is building, with a potential breakout likely to follow.
How buying the dip and using 200X leverage looks to me when I wake up in the morning.
— Wall Street Memes (@wallstmemes) March 9, 2025
Buy and stake WSM now!: Wall Street Meme (WSM)