POL (ex-MATIC) Price Prediction: POL/USDT Market May See a Bullish Breakout Soon
Estimated Reading Time: 3 minutes
Don’t invest unless you’re prepared to lose all the money you invest. This is a high-risk investment and you are unlikely to be protected if something goes wrong. Take 2 minutes to learn more

POL (ex-MATIC) Price Prediction (January 11):
Since price activity in the POL (ex-MATIC) market poked through the $0.7000 price level, this market has been retracing to lower price levels. However, now it appears that this market is preparing for another breakout.
POL/USDT Long-Term Trend: Bearish (Daily Chart)
Key Price Levels:
Resistance: $0.5000, $0.5500, $0.6000
Support: $0.4500, $0.4000, $0.3500
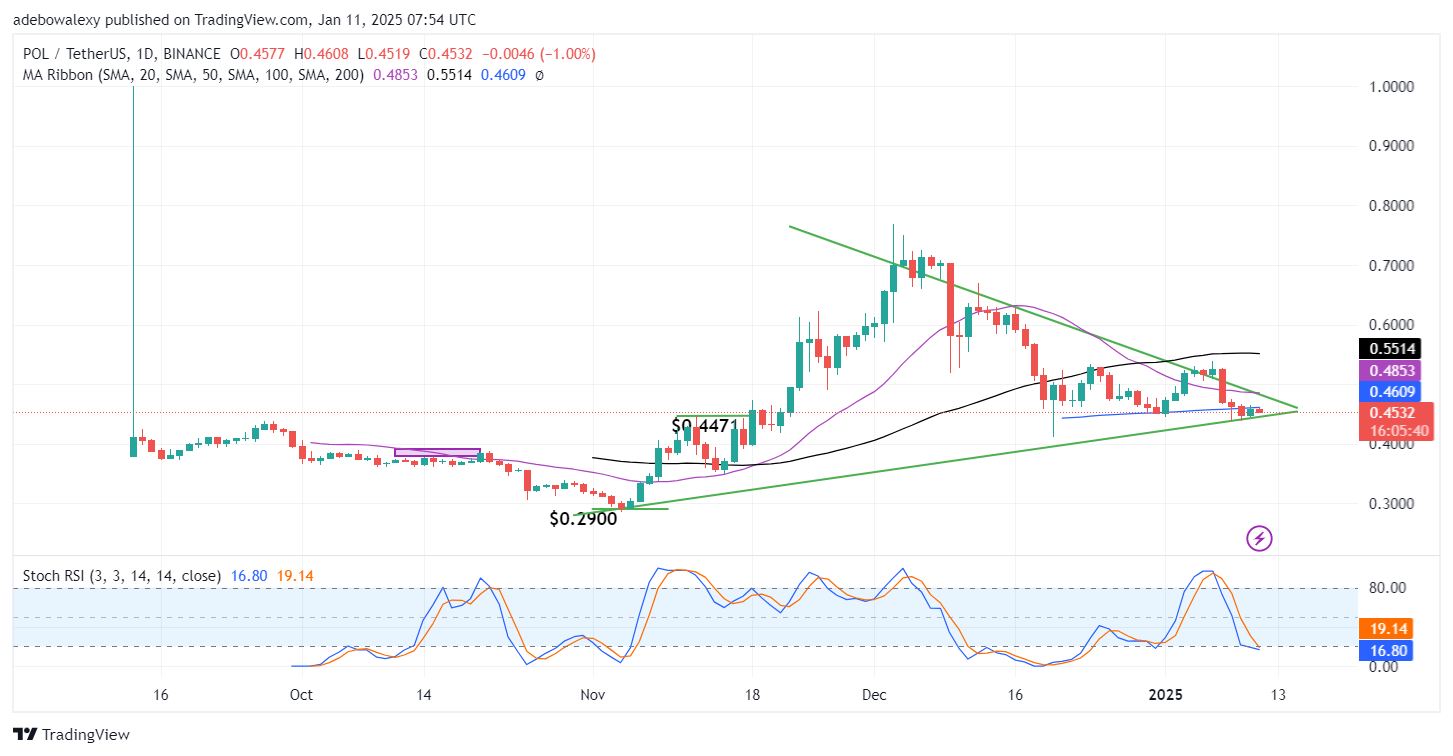
The ongoing session has brought a minor downward retracement to this market. Nevertheless, price action continues to hover around the 100-day Moving Average (MA) lines. Meanwhile, the Stochastic Relative Strength Index (RSI) lines can be seen pointed towards the oversold region of the indicator. Likewise, the terminals of these indicator lines are converging just below the 20-threshold level of the indicator.
POL (ex-MATIC) Price Prediction: POL/USDT Seems to Have Bullish Potentials
Price activity in the POL (ex-MATIC) market has been mostly below the $0.600 price level in recent times. However, more recently, this price action has fallen below the 100-day MA line. Therefore, it implies that price action is now below all the MA lines on the chart.
However, this is just above the floor of the drawn symmetrical pattern on the chart. Also, the Stochastic RSI lines converge toward a bullish crossover in the oversold region. Technically, this hints at a potential breakout, which may be bullish in this market. This may cause price action to break through the next psychological resistance.
POL (ex-MATIC) Price Prediction: POL/USDT Bullish Breakout Looks Doubtful (4-Hour Chart)
By extending this market analysis to a 4-hour price chart, one can see that price action remains below all the MA lines on the chart. This poses a significant threat to the anticipated bullish breakout. The last price candle on the chart is red and quite small but suggests that bears are in the lead. The Stochastic RSI lines are also in the overbought region with the lead line pointed slightly toward the 80 level of the indicator.
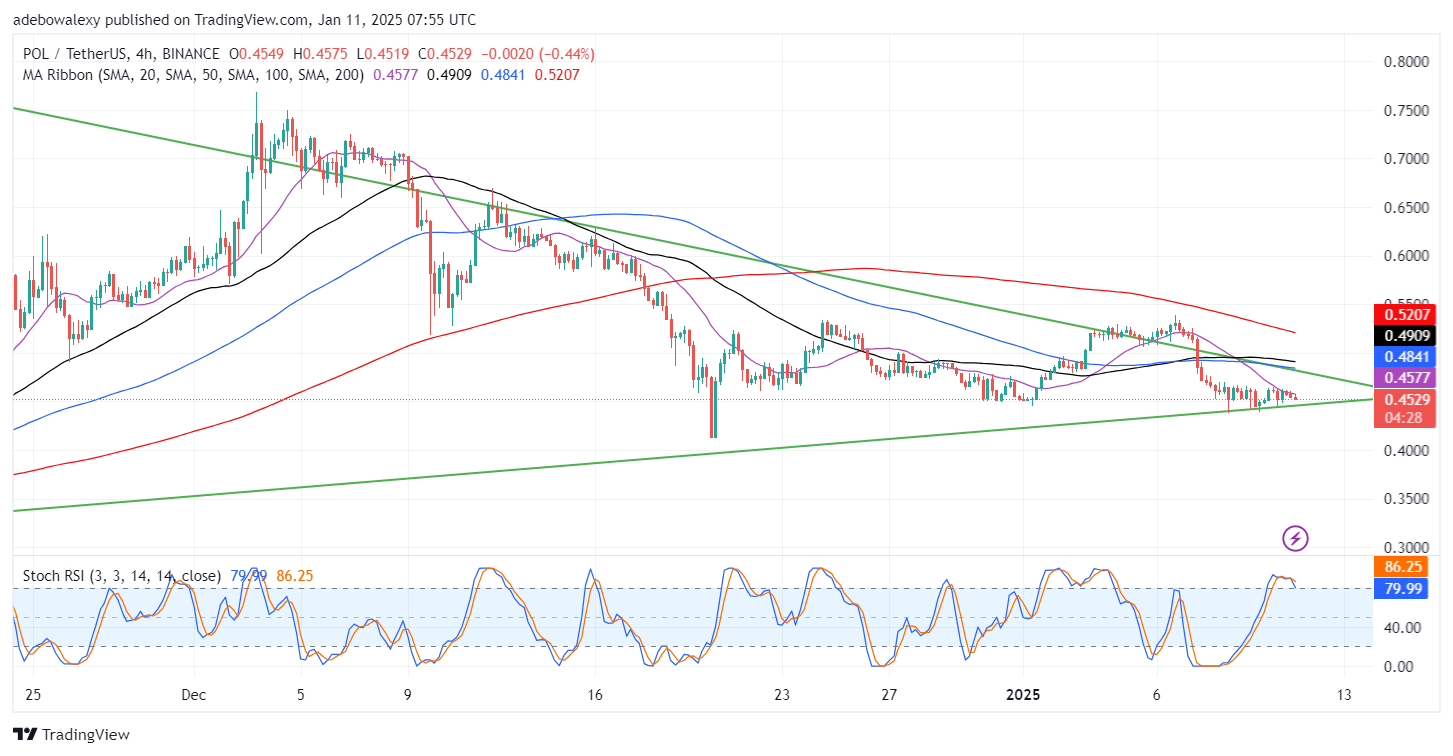
However, price activity can be seen respecting the floor of the drawn symmetrical triangle pattern as more recently appearing price candles continue to hover around the 20-day MA line. While bullish activity may seem latent, this might be an opportunity to get in early for at least short-term gains toward the $0.5000 price level.