Wall Street Memes (WSM) Price Makes Basis, Making Rises
Estimated Reading Time: 3 minutes
Don’t invest unless you’re prepared to lose all the money you invest. This is a high-risk investment and you are unlikely to be protected if something goes wrong. Take 2 minutes to learn more
Wall Street Memes Price Prediction – March 12
There has been a continuation of seeing the market operations of WSM/USD having feeble movements in a series on the threshold of the lower Bollinger Band, as the crypto-economic price makes basis in its setting, making rises in its form to signify that buying options are being garnered.
The recent price action of Wall Street Memes coin, relative to the US dollar, has shown a consistent buildup around the lower support level of $0.001, positioning itself for potential sharp rebounds that could drive further upward momentum. Indicators suggest that bulls are actively working to regain control and push against opposing market pressures.
WSM/USD Market
Key Levels
Resistance levels: $0.002, $0.0025, $0.003
Support levels: $0.001, $0.0008, $0.0006
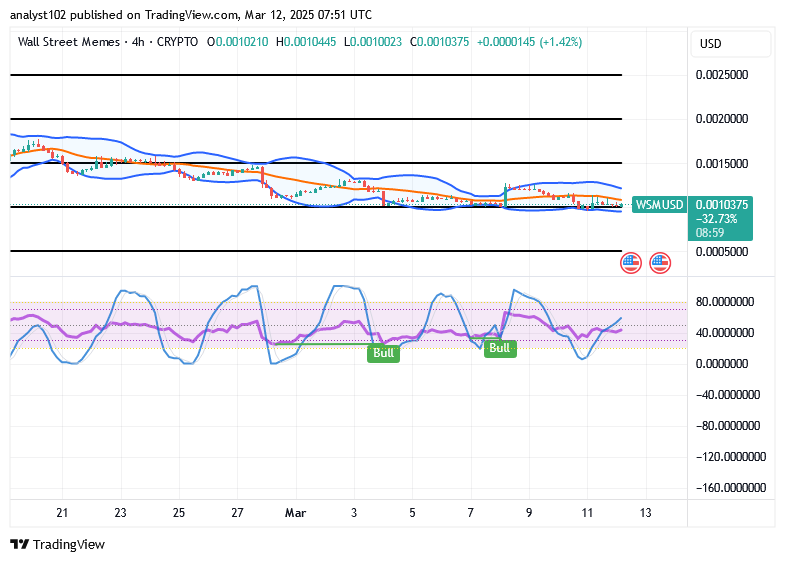
WSM/USD – 4-hour Chart
The medium-term chart (4-hour chart) of the WSM/USD trade presently showcases that the crypto-economic trade makes a basis, as the situation shows that the price is making rises.
There is a gradual shift in the stochastic oscillators, which are swerving northward, moving away from the 40-level mark. The Bollinger Bands indicators are slowly expanding from the baseline around $0.001, with most candlesticks forming within lower high ranges, suggesting a potential for further upward movement while maintaining some downward pressure.
From a technical standpoint, is it too high-risk for long-term position traders in the WSM/USD market to reconsider entering new positions at this stage?
As days are running by into weeks and possibly into several months, given that the pricing motions in the business deals of the WSM/USD market make a basis at lower ends plus make rises, it means buyers are in the mode of gaining momentum before regaining a significant comeback afterward.
The overall trade sentiment for the base trading instrument against its counter currency suggests that sellers should exercise caution when executing orders to avoid being caught in sudden price reversals. The delay in the anticipated bounce is due to the strategy of allowing buyers more opportunities to accumulate positions at the instrument’s most favorable reduced prices.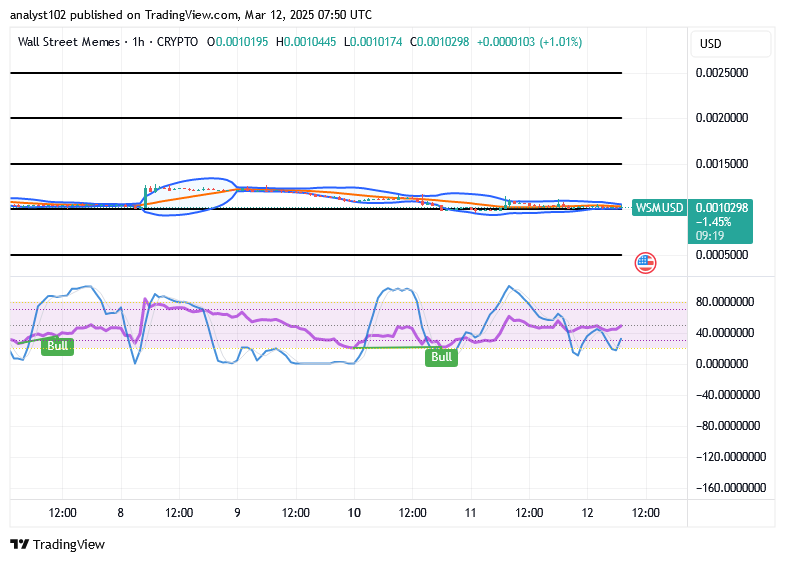
WSM/USD 1-hour chart
The 1-hour chart of the WSM/USD trade reveals that the crypto-economic trade presently makes a basis, making rises in its signification formation.
There has been a consistent maintenance of the eastward-trending trajectory of the Bollinger Bands, with the market line stabilizing around the $0.001 level. The stochastic oscillators have continued oscillating through various ups and downs, consistently holding a bullish signal note, indicating ongoing positive momentum in the market.
Someone please check on Elon.
Buy and stake WSM now!: Wall Street Meme (WSM)
Someone check on Elon pic.twitter.com/RkJKetMJPO
— Wall Street Memes (@wallstmemes) March 11, 2025