Solana Price Prediction: SOL/USDT May Fall Below the $185 Support
Estimated Reading Time: 3 minutes
Don’t invest unless you’re prepared to lose all the money you invest. This is a high-risk investment and you are unlikely to be protected if something goes wrong. Take 2 minutes to learn more

Solana Price Prediction (January 10):
Solana’s price action seems to have found support and resistance at the $220 and $185 price levels. As a result, the market has been operating within this confine in recent times, as price activity could be seen rebounding off the $220 resistance and then respecting the support at $185 in the ongoing session.
SOL/USDT Long-Term Trend: Bullish (Daily Chart)
Key Price Levels:
Resistance: $200, $250, $300
Support: $185, $150, $120
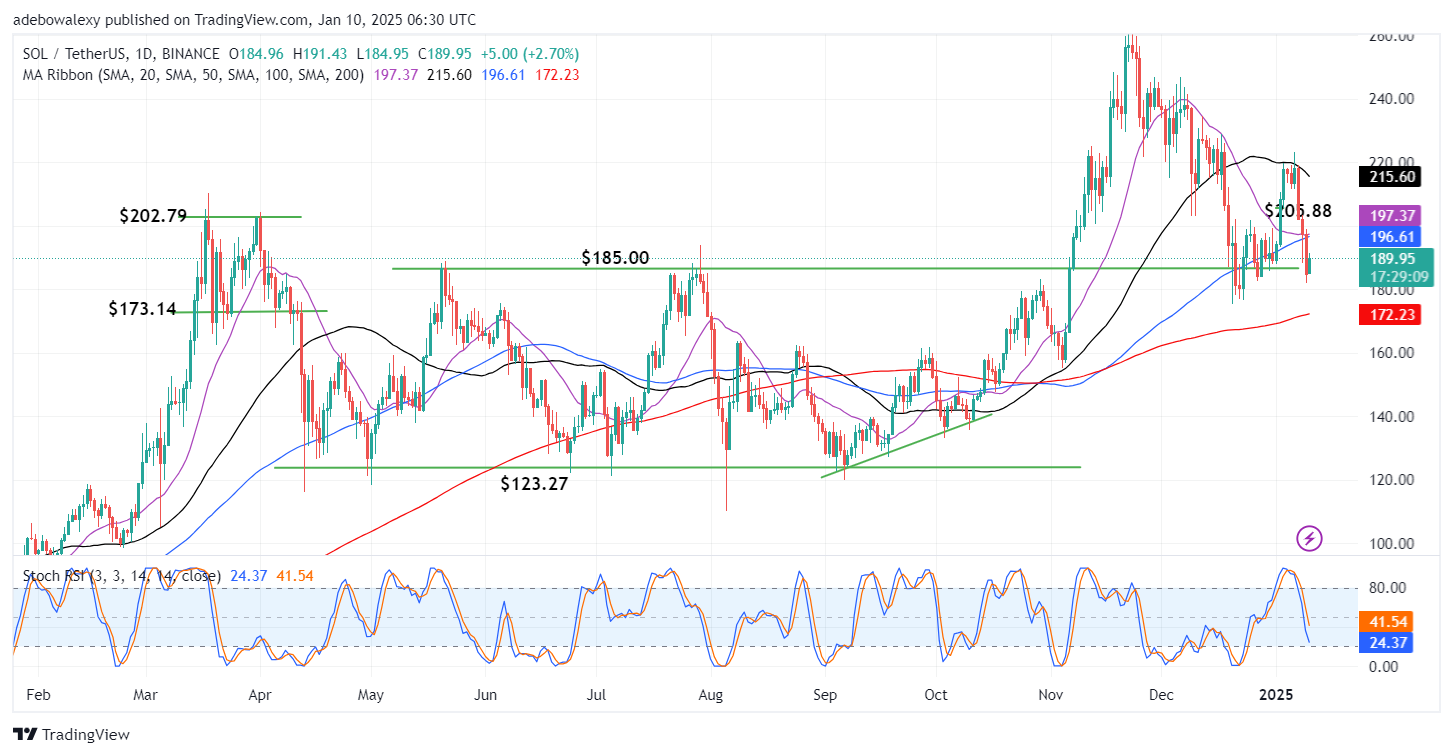
Solana’s price action had proceeded rapidly downwards after hitting the resistance at $220. However, the ongoing session has rebounded upwards, bringing the market back above the medium-term support at the $185 price mark. Nevertheless, this keeps the market trading below most of the MA lines on the chart. Also, the 20- and 100-day MA lines can be seen converging above the last price candle on the chart. In addition, the Stochastic Relative Strength Index (RSI) lines also fall into the oversold region.
Solana Price Prediction: SOL/USDT Upside Retracement Seems an Uphill Task
It could be seen that price action in the Solana daily market as of today has seen an upward rebound. Also, the corresponding price candle stays green. Meanwhile, the 20- and 100-day MA lines can be seen constituting a strong barrier for further upside retracements via their convergence below the last bullish candle on the chart.
Additionally, the Stochastic Relative Strength Index (RSI) lines can be seen still falling into the oversold region. Combining the implication of the MA line convergence and the downward trajectory of the RSI lines, one can suggest that bullish traders may be up for a test of guts, as price action may fall below the next technical support.
Solana Price Prediction: SOL/USDT Upside Retracement Is Facing a Rejection (4-Hour Chart)
The SOL 4-hour market has helped reveal what’s ongoing in the market as of the latest. Here, a green price candle has appeared for the ongoing session. However, the price candle mentioned has a visible upper shadow and has appeared below all the MA lines on the chart. Similar to what was observed on the daily chart, the 20- and 10-day MA lines here have delivered a crossover above price action.
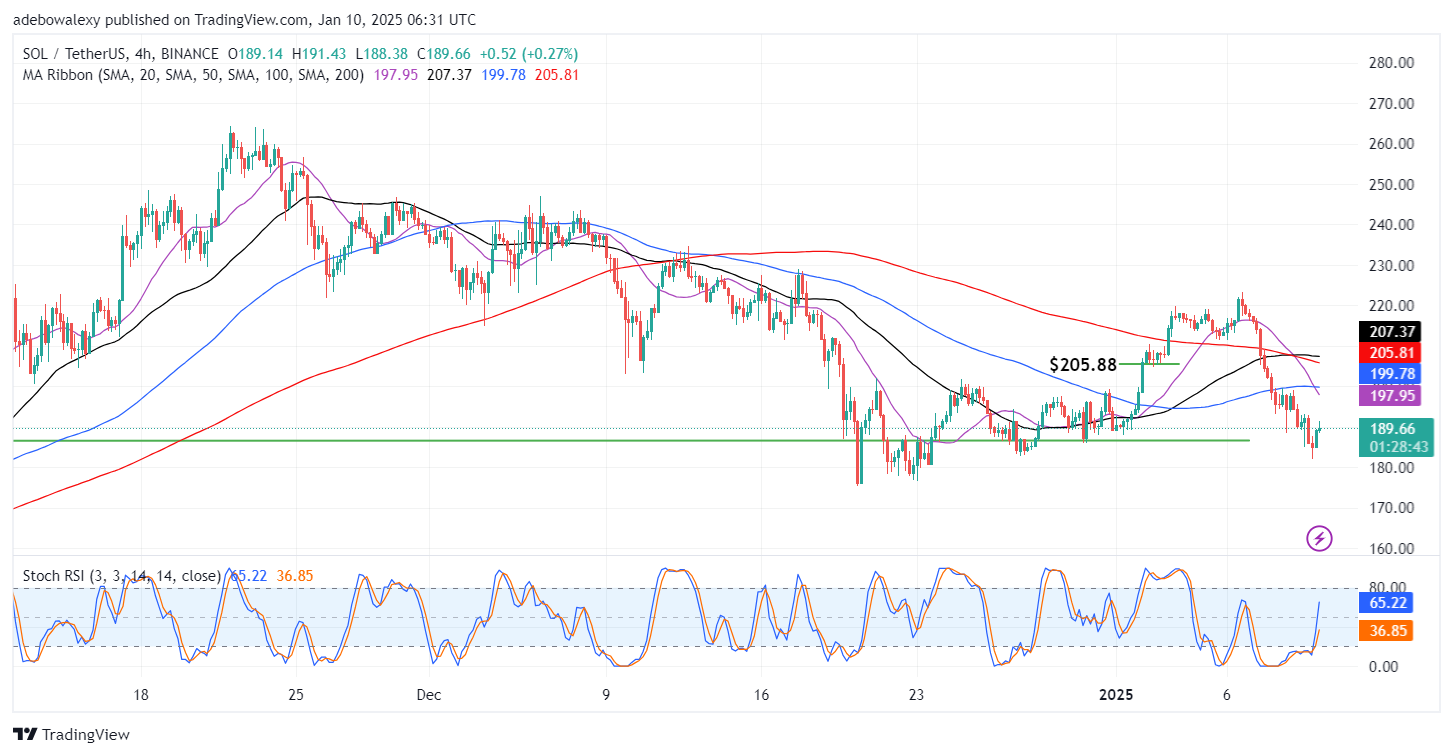
Meanwhile, the Stochastic RSI lines are rising upward into the overbought region. The movement of the RSI seems a bit exaggerated and as such hints that upside forces may lack the strength to achieve a bullish reversal. A convincing bullish reversal in this market will require some catalyst. Therefore, while eying the catalyst, traders may see this market returning toward the $180 mark.