Uniswap Price Prediction: UNI/USDT May Fall Through the $12.74 Support
Estimated Reading Time: 3 minutes
Don’t invest unless you’re prepared to lose all the money you invest. This is a high-risk investment and you are unlikely to be protected if something goes wrong. Take 2 minutes to learn more

Uniswap Price Prediction (January 9):
The Uniswap market has been quite volatile recently. This has made it a bit challenging to determine price directions. The market is currently heading south in what seems like a very strong downward retracement.
UNI/USDT Long-Term Trend: Bullish (Daily Chart)
Key Price Levels:
Resistance: $14.00, $16.00, $18.00
Support: $12.00, $10.00, $8.00
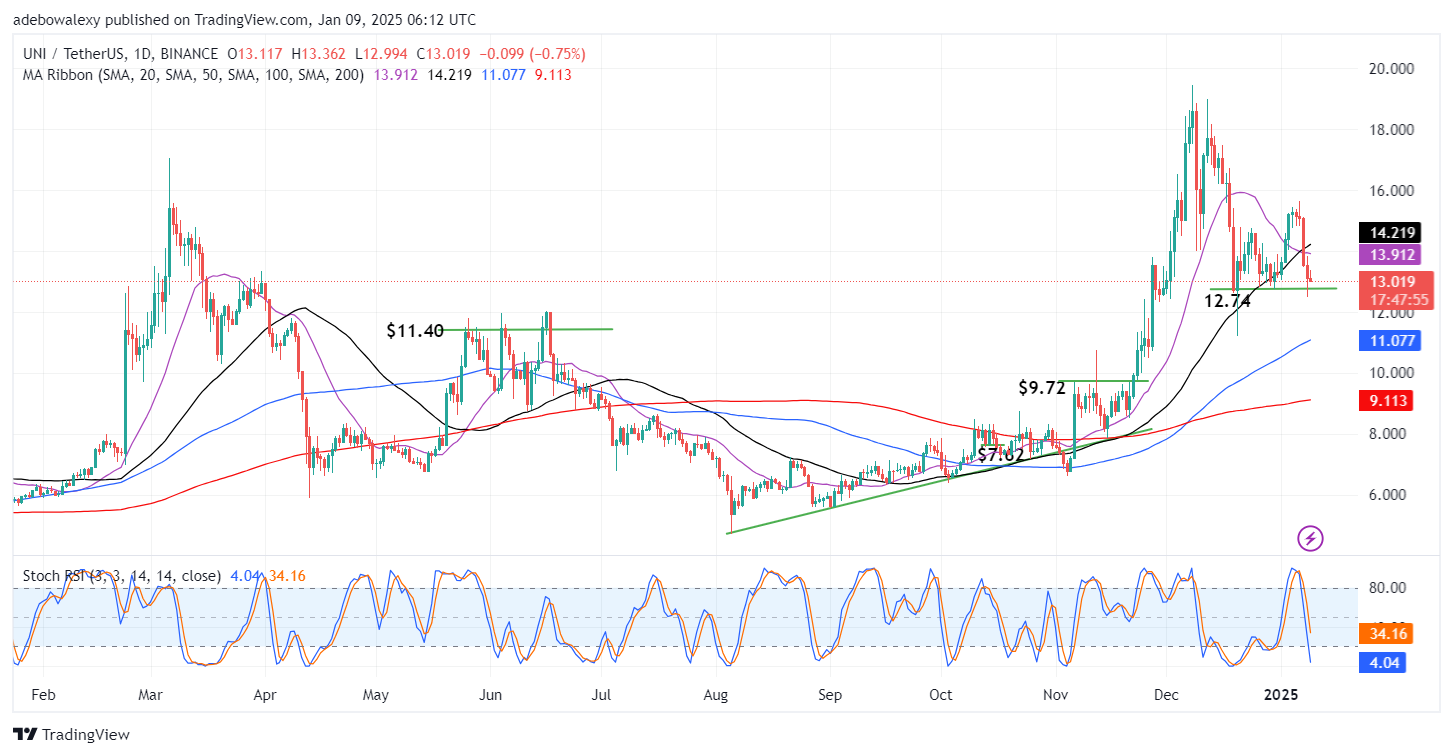
However, the last price candle here has appeared smaller than the previous ones. Nevertheless, the token’s price action stays above the support at the $12.74 threshold level. Also, trading in this market now occurs below the crossed 20- and 50-day MA lines. Meanwhile, the Stochastic Relative Strength Index (RSI) lines have fallen very sharply and deeply into the oversold region.
Uniswap Price Prediction: UNI/USDT Bears Reign May Be Breached at the $12.74 Threshold
Although recent price activity in the Uniswap daily market is bearish, one thing is for sure. It could be seen that the downward retracement in the market seems to be losing steam as we approach the $12.74 price level. This could be seen through the appearance of the last price candle on the chart.
This suggests that the downward retracement may be breached at the mentioned support level if it holds. However, the Stochastic RSI lines seem to hint at the fact that buyers aren’t putting in much effort toward breaching the price decline here. Therefore, this calls for a much closer examination.
Uniswap Price Prediction: UNI/USDT Buyers Look Overwhelmed (4-Hour Chart)
In the Uniswap 4-hour market, price action continues to hover above the support at $12.74. Lately, price candles on the chart seem quite small and, as such, portray a reducing bearish momentum as earlier stated. However, here, price action lies below all the MA lines on the chart. Interestingly, the market had rebounded off the mentioned technical support during the past two sessions.
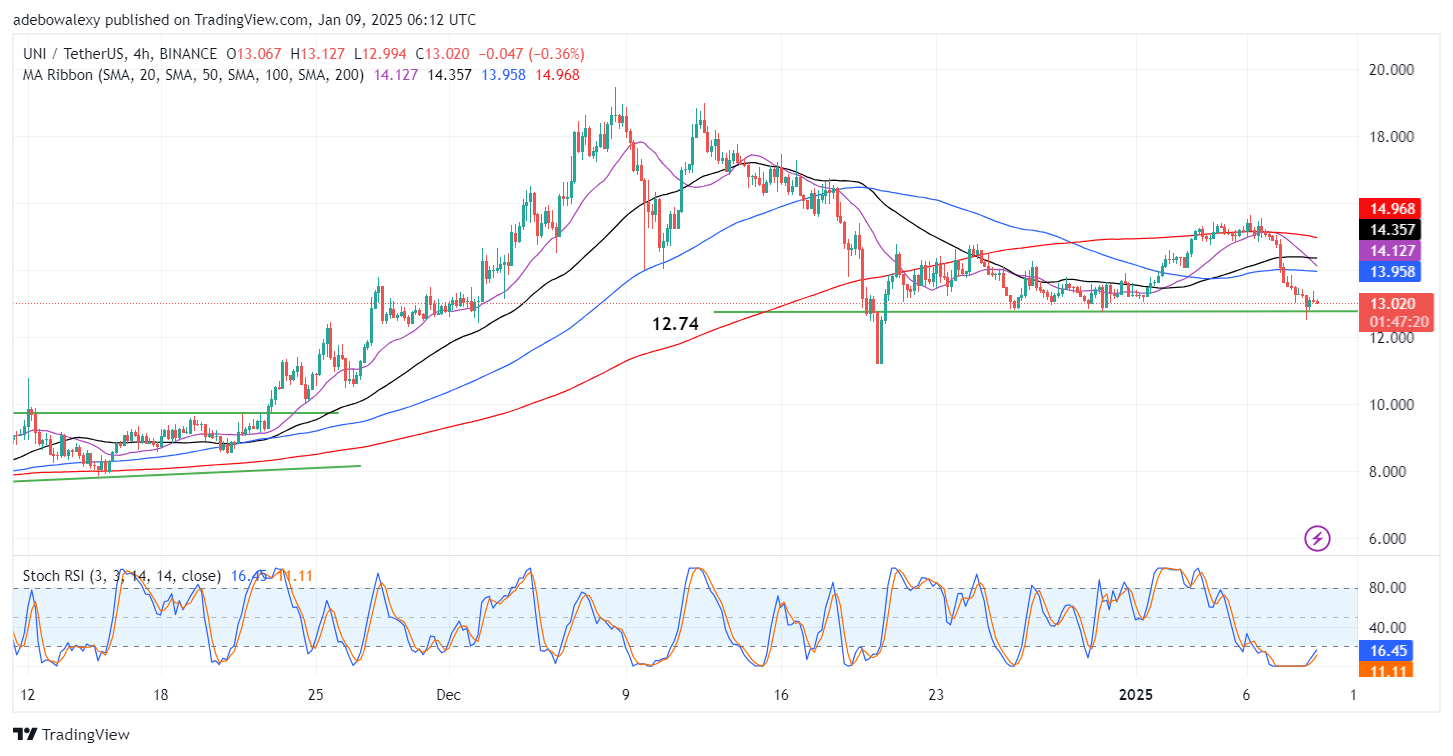
This has kept the market above the $12.74 support level despite subsequent minimal downward retracements. As a result, the Stochastic RSI lines now have an upward trajectory. Consequently, indications here suggest that the support may hold. However, the position of price action below all the MA lines suggests that the market may fall towards the $12.00 mark.