Wall Street Memes (WSM) Price Keeps Up, Featuring Rises
Estimated Reading Time: 3 minutes
Don’t invest unless you’re prepared to lose all the money you invest. This is a high-risk investment and you are unlikely to be protected if something goes wrong. Take 2 minutes to learn more

Wall Street Memes Price Prediction – March 9
Upward and downward pricing moves that have been taken by both bulls and bears in the business lines of the Wall Street Memes coin pairing with the valuation of the US dollar have been seen over time, being conjectured as momentum, as the recent crypto-economic move portends that the price keeps up above $0.001, featuring rises in its probable actions.
The WSM/USD market has seen a growing pattern as buyers have pushed the price to a notably higher level of around $0.0011875. Given this price action, it is expected that bulls will soon take control by consolidating their position and continuing their efforts to drive the market higher.
WSM/USD Market
Key Levels
Resistance levels: $0.002, $0.0025, $0.003
Support levels: $0.001, $0.0008, $0.0006
WSM/USD – 4-hour Chart
The medium-term chart (4-hour chart) of the WSM/USD trade keeps up in its moving momentum, featuring rises to the upper part of the indicators.
The trend formation of the Bollinger Bands indicates that the base instrument is gaining momentum, suggesting a higher likelihood of upward price movement in the near future. Meanwhile, the stochastic oscillators have moved into the overbought region, further supporting the potential for continued bullish momentum.
Will there be a pull-down before the WSM/USD market surges back over the overhead barriers?
There might be a need for the WSM/USD trade to shift slightly back downward in regards to the positioning pace of the oscillators at this time in the overbought area before gaining steady pushing velocities, as the price keeps up above $0.001, featuring rises in a low format.
The fluctuating market value of the Wall Street Memes coin against the US Dollar has manifested in a series of sideways movements between the $0.0015 and $0.001 levels. This consolidation phase is expected to persist, providing a favorable opportunity for accumulating the asset in anticipation of a significant rebound in the future.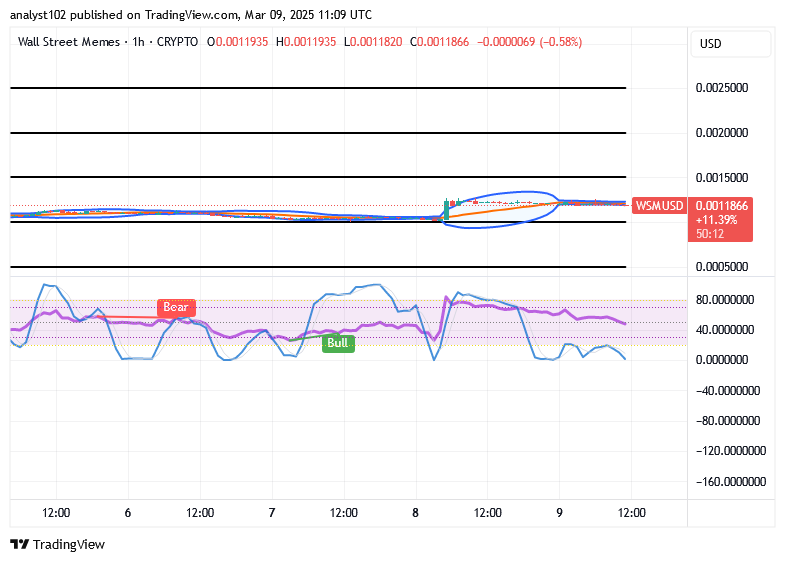
WSM/USD 1-hour chart
The 1-hour chart from the technical arrangements of the WSM/USD market showcases that the price keeps up, featuring rises.
There has been a repositioning stature in the way that the trend lines of the Bollinger Bands have been placed to the eastward. The stochastic oscillators are again swinging in the oversold region, indicating that selling moves are on the verge of fading out soon.
Buy and stake WSM now!: Wall Street Meme (WSM)
— Wall Street Memes (@wallstmemes) March 9, 2025