Wall Street Memes (WSM) Trade Reshapes, Muscling Bounces
Estimated Reading Time: 3 minutes
Don’t invest unless you’re prepared to lose all the money you invest. This is a high-risk investment and you are unlikely to be protected if something goes wrong. Take 2 minutes to learn more

Wall Street Memes Price Prediction – March 7
A line of slighter lows has continued prevailing in the systemic methods of seeing the market operations of Wall Street Memes coin holding lower highs around $0.001, as the crypto-economic trade reshapes basis against the worth of the US dollar, muscling bounces steadily in its signal composure outlook.
So far today, market activity has aligned with the expectation of further opportunities to accumulate dip buys, as the long-term outlook remains favorable for substantial appreciation of the base instrument. Given this sentiment, holding positions for the long term is the optimal strategy, considering that the crypto market is still undervalued.
WSM/USD Market
Key Levels
Resistance levels: $0.002, $0.0025, $0.003
Support levels: $0.001, $0.0008, $0.0006
WSM/USD – 4-hour Chart
The medium-term chart (4-hour chart) of the WSM/USD trade shows that the price reshapes around $0.001, muscling bounces in inputs.
The candlesticks’ resurfacing pattern has been dominating the lower Bollinger Band indicator trend line and remaining well below the middle Bollinger Band portion of the indicator overall. The stochastic oscillators are now making a minor northbound-crossing mode at about 40 points after veering southward into the oversold area.
Is there any concrete evidence that the WSM/USD market may drop much above the $0.001 trading price in the upcoming sessions?
Nursing the possibility of the WSM/USD market bears steadily pushing against the lower end of the Bollinger Band indicator at this time would practically violate the principles of technical analysis, given that the base instrument is currently reshaping and gaining momentum for potential bounces.
The scenario is still to maintain the price movements busy in order to gain momentum from the scratch value zones, as there has been evidence of slowing down optimum actions to accelerate the market line, especially to the upside. The overall conclusion drawn from this article is that purchasers should never give up, and they are even encouraged to obtain additional points before the alleged rebounds take off quickly.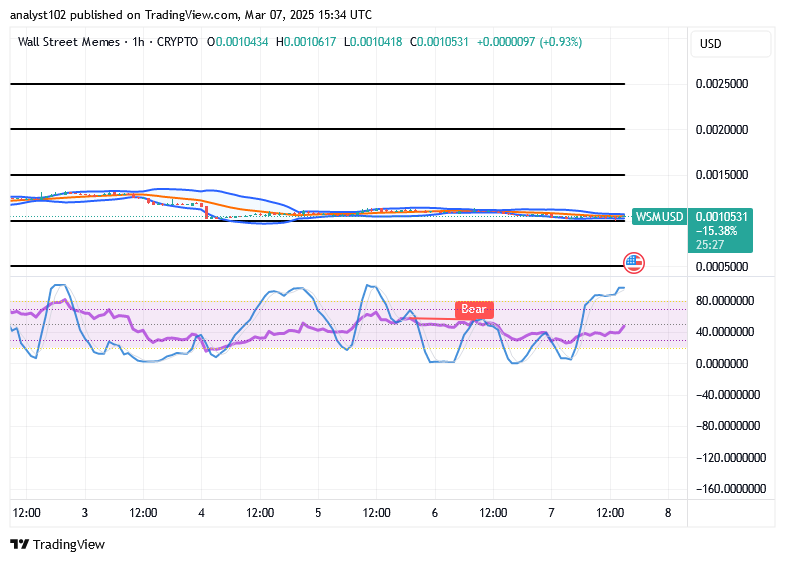
WSM/USD 1-hour chart
The 1-hour chart from the technical arrangements of the WSM/USD trade presently reshapes its baseline, muscling bounces in its signal setup.
As shown by the stochastic oscillators’ positioning pattern—they have entered the overbought area with a bearish signal note—the price is likely to experience more consolidation or delays before making a clear move in either direction. The trend lines of the Bollinger Bands are extending eastward, with the $0.001 level acting as a pivotal zone.
It’s time to start drinking Red Bull.
Time to crack out the Red Bull https://t.co/EXPUi8fD4n pic.twitter.com/pckS0SAuqC
— Wall Street Memes (@wallstmemes) March 7, 2025
Buy and stake WSM now!: Wall Street Meme (WSM)