Wall Street Memes (WSM) Price Softens, Conjecturing Rallies
Estimated Reading Time: 3 minutes
Don’t invest unless you’re prepared to lose all the money you invest. This is a high-risk investment and you are unlikely to be protected if something goes wrong. Take 2 minutes to learn more

Wall Street Memes Price Prediction – March 6
From most of the bottom formation patterns that have been surfacing for a couple of sessions, it is indicated that the WSM/USD market bulls have been continually building up at a low pace, given that the present financial situation reveals that the crypto-economic price softens actions, conjecturing rallies in its inputs.
Lower highs in lesser amounts have been a defining feature of the dominant purchasing and selling attempts. Given that feeling, using strong rebounding moves in the long-term running mode provides warning signals to different traders about the execution of shorting orders.
WSM/USD Market
Key Levels
Resistance levels: $0.002, $0.0025, $0.003
Support levels: $0.001, $0.0008, $0.0006
WSM/USD – 4-hour Chart
The medium-term chart (4-hour chart) of the WSM/USD trade presently softens pricing movement orders, conjecturing rallies in its ramification signal outputs.
There has been steady rebuilding of decent thresholds on the part of the candlesticks being formed over a couple of hours within the zones of the Bollinger Bands indicators. The stochastic oscillators are in a mode of northbound-swerving style, making a strong baseline on the signal note of bullish momentum, suggesting potential upward movements ahead.
Will there be more pull downs in the future based on the positioning pattern of the WSM/USD market oscillators from the perspective of a medium-term setup?
It is likely to witness a line of draw-downs or to see a continuation of pause sessions for a sizeable number of times before getting back rebounds, given that the WSM/USD market currently softens, conjecturing rallies.
Long-term investors will continue to benefit from the paired market instruments as things are predicted based on our suggestions, particularly because the price is currently undergoing an unusually strong bounce-off. As a result, the accumulation of additional points needs to continue before the anticipated rising cycle.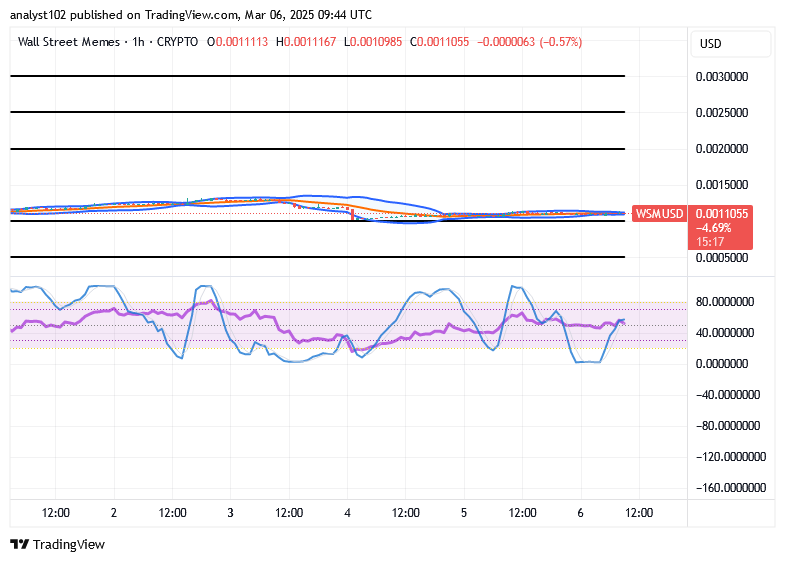
WSM/USD 1-hour chart
The 1-hour chart from the technical arrangements of the WSM/USD trade softens movements, conjecturing rallies in its behavioral systems.
The $0.001 level has remained a critical support zone, marked by a horizontal line to indicate the potential reversal point where bears have been dominant in the market for some time. The stochastic oscillators are exhibiting free movement, signaling that buyers are preparing for a potential reversal and are likely to make a comeback soon.
Pi currency miners that have been active since 2019
Bros that have been mining Pi coin since 2019 pic.twitter.com/7vcoofqagg
— Wall Street Memes (@wallstmemes) March 5, 2025
Buy and stake WSM now!: Wall Street Meme (WSM)