Wall Street Memes (WSM) Trade Is on a Base, Holding Spirals
Estimated Reading Time: 3 minutes
Don’t invest unless you’re prepared to lose all the money you invest. This is a high-risk investment and you are unlikely to be protected if something goes wrong. Take 2 minutes to learn more

Wall Street Memes Price Prediction – March 5
It has been persistently demonstrated that formulation processes are the way of making the WSM market bulls take formidable stances against the market worth of the USD market sellers, as the financial output currently shows that the crypto-economic trade is on a base, holding spirals.
From a broader perspective, the indicator setup suggests that buying pressure has strengthened, as long as the lower support level at $0.001 holds firm against any potential downward moves in the long term. Despite this, the price action has been showing signs of a favorable opportunity, with accumulation occurring in anticipation of the long-expected rebound.
WSM/USD Market
Key Levels
Resistance levels: $0.002, $0.0025, $0.003
Support levels: $0.001, $0.0008, $0.0006
WSM/USD – 4-hour Chart
The medium-term chart (4-hour chart) of the WSM/USD trade is on a base formulation proceeding, holding spirals in inputs.
The trending postures of the Bollinger Bands indicators have been gently widened to create sizeable trade zones of $0.0015 and $0.001, showcasing the lower end by which dip buys execution could be taken. The stochastic oscillators have moved back southbound into the oversold region, attempting to cross back northbound by placing briefly slantingly to the point of 40.
As it has been showcased, would the WSM/USD market lose more value steadily against $0.001 in the near time?
From a practical technical standpoint regarding the formation of the indicators in this analysis, it is advisable for buyers to accumulate more positions at the lower price point of Wall Street Memes (WSM) coin compared to the purchasing power of the U.S. dollar, as the current situation indicates that the price is on a base, holding steady with potential for upward movement.
All indications currently suggest that bulls are actively working to build momentum and defend against any potential pullbacks that may occur in the upcoming sessions. The positioning of the oscillators is at an optimal level, confirming that buying options are likely to be the more favorable decision moving forward.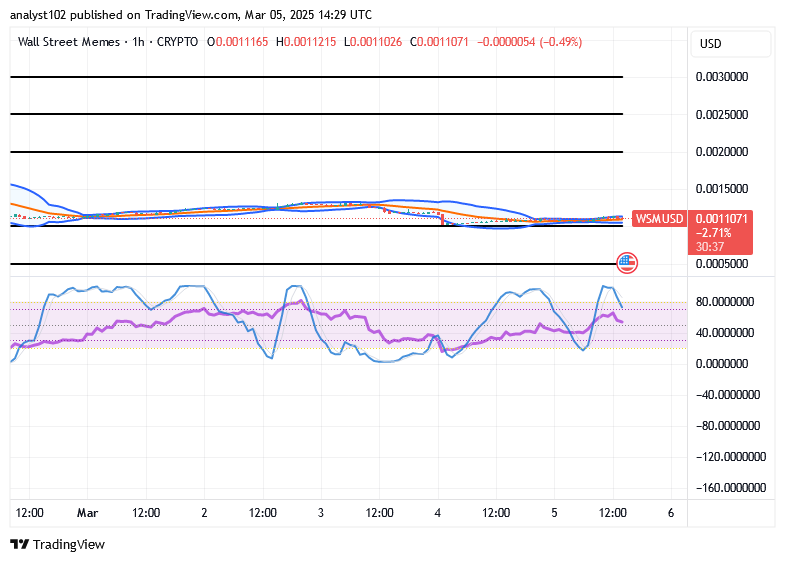
WSM/USD 1-hour chart
The 1-hour chart from the technical arrangements of the WSM/USD trade shows that the crypto-economic price is on a base, holding spirals.
The oscillating patterns exhibited by the stochastic oscillators are signaling that the price movements have been confined to a sideways range. Meanwhile, the Bollinger Bands indicators suggest that a bullish flag formation is imminent, pointing to a potential breakout to the upside.
“Everything okay, babe? You’ve been in there for a while.”
“You ok babe, you been in there a while” pic.twitter.com/QTbzBuJ40M
— Wall Street Memes (@wallstmemes) March 4, 2025
Buy and stake WSM now!: Wall Street Meme (WSM)