Wall Street Memes (WSM) Price Pushes Low, Making Bounces
Estimated Reading Time: 3 minutes
Don’t invest unless you’re prepared to lose all the money you invest. This is a high-risk investment and you are unlikely to be protected if something goes wrong. Take 2 minutes to learn more

Wall Street Memes Price Prediction – March 4
Buying and selling impulses are being exhibited in the worth of the Wall Street Memes coin versus the valuation of the US dollar as being seen pushing low, making bounces in the proceedings of that technical observation.
A greater window of opportunities has been provided from the aspect of signal notes, noting that more often than not, once the price touches the lower part of the Bollinger Band indicator, re-buying momentum is obtained, signaling potential upward movement. With the positioning posture of the oscillators in the oversold coupled with a smaller bullish candlestick in the making, it indicates that the base is on the verge of gaining catalysts, paving the way for potential market recovery.
WSM/USD Market
Key Levels
Resistance levels: $0.002, $0.0025, $0.003
Support levels: $0.001, $0.0008, $0.0006
WSM/USD – 4-hour Chart
The medium-term chart (4-hour chart) of the WSM/USD market showcases that the crypto-economic price pushes low, making bounces.
The stochastic oscillators have swerved steadily southbound into the oversold region, signaling the possibility of ending the moves to the downward side in the near term. The Bollinger Bands indicators have remained placed eastward closely below the point of $0.0015, showing limited upward pressure.
As the WSM/USD market trades at $0.0010564, reaching the lower Bollinger Band, will the upcoming moves lose momentum?
Over a couple of sessions involving several days running into weeks back, the pricing motions in the WSM/USD market have been featuring lower highs a bit beyond lower lows to portend that bulls are deep in continual processes of finding momentum, given that the crypto economy pushes low, making bounces in inputs.
In this regard, traders in the marketing lines of WSM/USD trade needed to be patient as regards seeing the base instrument resuming massive rallies in the near future. And that sentiment is believably going to happen without being noticed in any time. Long-term holding of positions opened has to be the guiding principle as regards the trade approach, ensuring sustained growth.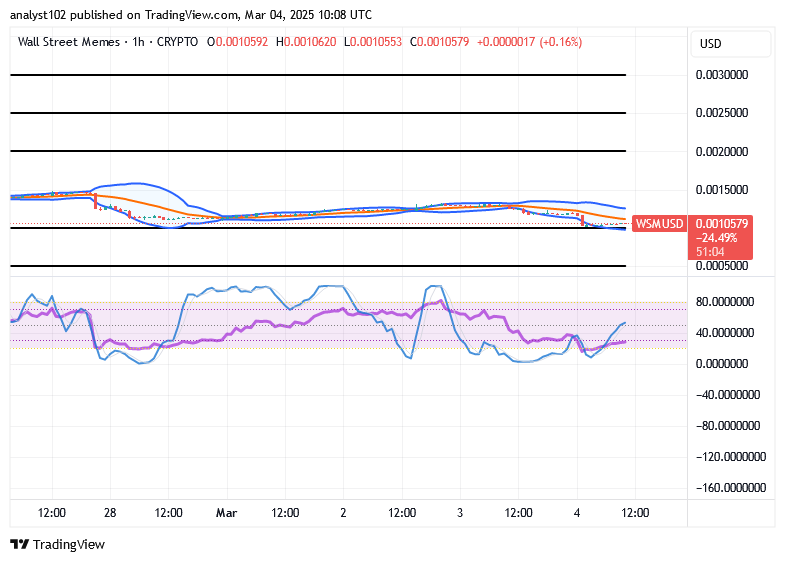
WSM/USD 1-hour chart
The 1-hour chart from the technical arrangements of the WSM/USD market presently pushes low, making bounces.
The current positioning of the Bollinger Bands indicates a series of lower lows in the price movement. The stochastic oscillators have shifted southward, signaling a potential reversal to the upside. As such, buying opportunities are favored, and positions based on this setup should be allowed to run with minimal interference for a period of time.
Crypto enthusiasts who purchased Bitcoin at $16K in 2022
Crypto bros who bought Bitcoin at $16K in 2022 pic.twitter.com/90s2K9QOdD
— Wall Street Memes (@wallstmemes) March 3, 2025
Buy and stake WSM now!: Wall Street Meme (WSM)