Wall Street Memes (WSM) Trade Is Feeble, Pushing for Spikes
Estimated Reading Time: 3 minutes
Don’t invest unless you’re prepared to lose all the money you invest. This is a high-risk investment and you are unlikely to be protected if something goes wrong. Take 2 minutes to learn more
Wall Street Memes Price Prediction – March 3
The level of persistence of showcasing that bulls are on the top of holding back ideal catalysts to produce valuation increases in the proceedings of Wall Street Memes coin striving to gain a stance against the economic worth of the US dollar is steadily accomplishing, given that the base instrument is currently feeble, pushing for spikes in its overall potential movements in the near session.
Based on the technical analysis, accumulating positions at the current WSM trade levels appears to be a prudent strategy for long-term traders. Additionally, buyers may experience minor pullbacks within the price range of $0.0015 to $0.001 before the market stabilizes and begins to rally.
WSM/USD Market
Key Levels
Resistance levels: $0.002, $0.0025, $0.003
Support levels: $0.001, $0.0008, $0.0006
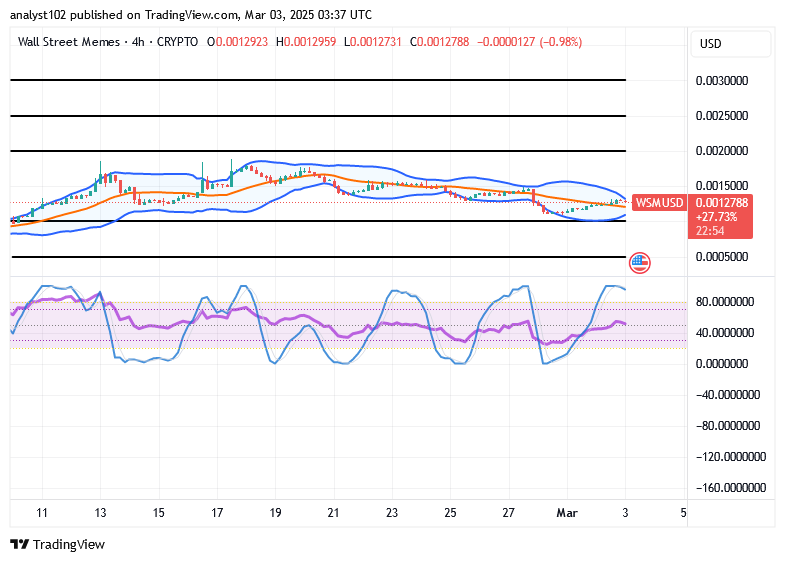
WSM/USD – 4-hour Chart
The medium-term chart (4-hour chart) of the WSM/USD market shows that the crypto-economic line is feeble, pushing for spikes.
The Bollinger Bands indicators’ trend lines are showing a repositioning effort, aiming to establish a strong threshold that could support dip-buy opportunities in the long-term trend. The stochastic oscillators have moved northward into the overbought region, suggesting that a pause in upward momentum is likely. However, this does not indicate an impending reversal in the near-term price action.
In accordance with the indicators’ reading pace, will the WSM/USD market break out at the $0.0015 point soon?
Expectation notes on whether or not the WSM/USD market line will break out against the barrier of $0.0015 have not been having formidable traces, as the pricing movements are liable to suffer some delays, given that the market is feeble, pushing for spikes at a low capacity rate.
Short-term sellers are advised not to hold their positions for extended periods, especially when they observe an entry opportunity near the upper Bollinger Band. Given that the oscillators indicate an overbought condition, a pullback is likely, which could allow the market to reestablish its lower levels.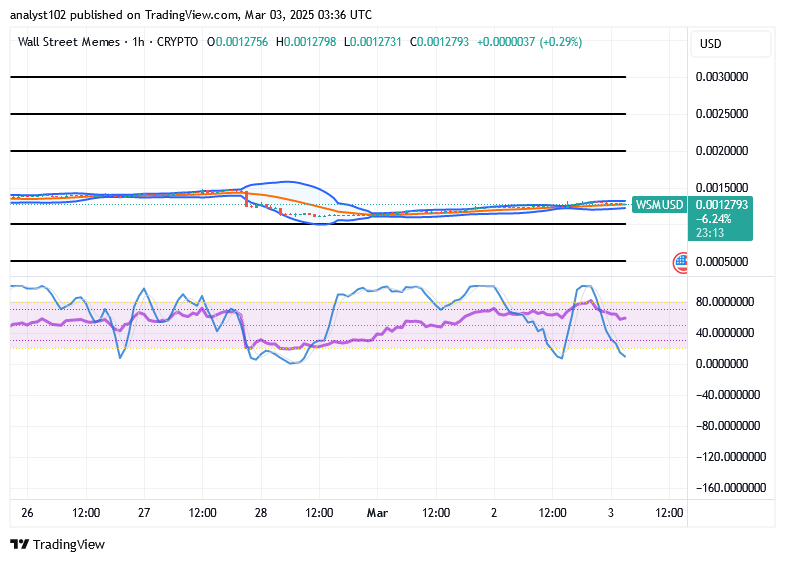
WSM/USD 1-hour chart
The 1-hour chart from the technical arrangements of the WSM/USD market at the time of today’s write-up shows that the price is feeble, pushing for spikes.
The stochastic oscillators have shifted southward, aiming to diminish the likelihood of downward market movements from a near level just above the $0.001 mark. The Bollinger Bands’ trend lines have maintained a closely aligned, east-northeast orientation, reflecting a tentative posture.
UPDATED: In the last four hours, the cryptocurrency market has gained about $330,000,000,000.
We are so back https://t.co/vUzDd3CZvk pic.twitter.com/Jiqg2KSbf1
— Wall Street Memes (@wallstmemes) March 2, 2025
Buy and stake WSM now!: Wall Street Meme (WSM)