Ethereum’s Range Shrinks below $1,640 as Traders’ Show Disinterest
Estimated Reading Time: 2 minutes
Don’t invest unless you’re prepared to lose all the money you invest. This is a high-risk investment and you are unlikely to be protected if something goes wrong. Take 2 minutes to learn more

Ethereum Price Long-Term Analysis: Bearish
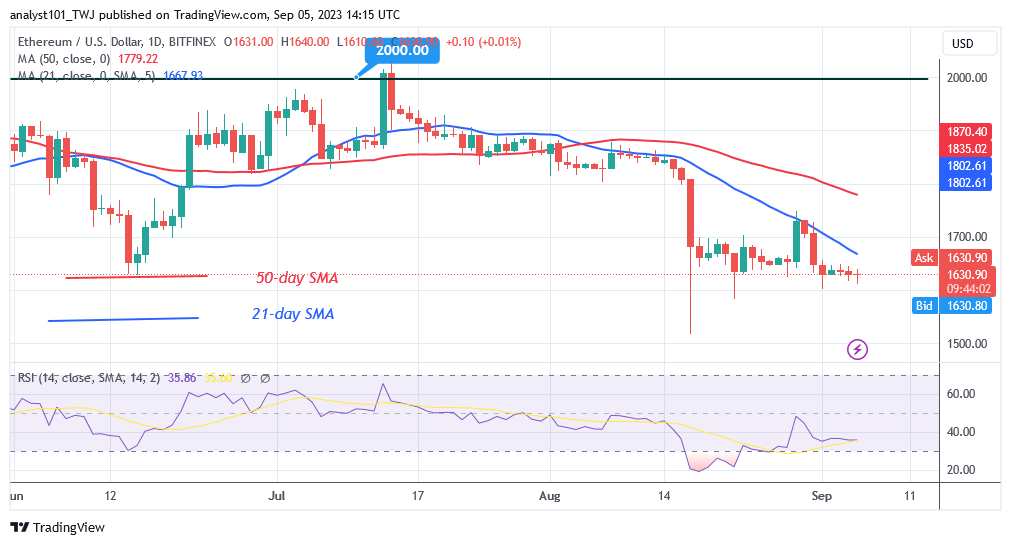
Ethereum (ETH) price has remained constant above the $1,600 support as traders’ show disinterest . The largest altcoin is currently limited to trading between $1,600 and $1,640. As Ether continues to fall in value, the bears have gained the upper hand. At the time of writing, the altcoin is worth $1,631. However, price movement has been static due to the dominance of Doji candlesticks.
The movement could stay within the range if the price stays steady. ETH/USD will trend if it rebounds or is rejected at its recent high. On the plus side, if Ether rebounds, it will rise over the moving average lines and the $1,748 resistance level. The altcoin will increase even further, reaching a high of $1,800. Ether will fall to the current support level of $1,600 and $1,517, where it faces rejection at the recent peak.
Technical indicators:
Major Resistance Levels – $2, 600, $2,800, $3,000
Major Support Levels – $1.600, $1, 400, $1,200
Ethereum Indicator Analysis
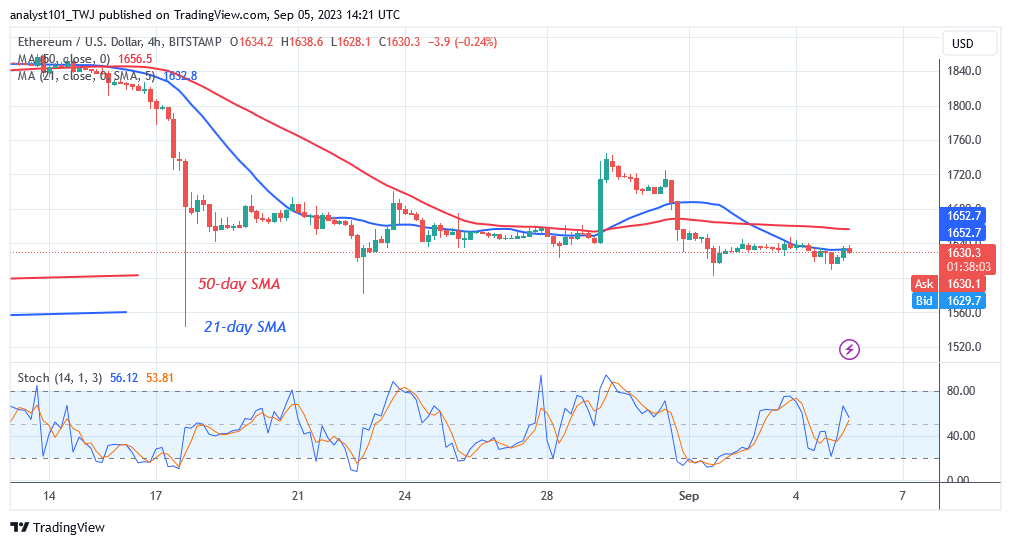
The price of Ether is horizontally flat as a result of the presence of Doji candlesticks. At Relative Strength Index level 35, it is in a bearish trend zone for period 14. The price of Ether declined when price bars were rebuffed at the 21-day SMA. It has a bearish momentum below the daily stochastic mark of 60. .
Conclusion
Ethereum’s price range has been narrowed to $1,600 and $1,640 as traders’ show disinterest . Due to the dominance of Doji candlesticks in market activity, market movement has been flat. The candlesticks show traders’ disinterest in the price action’s direction.
You can buy crypto coins here. Buy LBLOCK
Note: Cryptosignals.org is not a financial advisor. Do your research before investing your funds in any financial asset or presented product or event. We are not responsible for your investing results