XRP Holds Steady above $0.59 as It Reaches Bearish Exhaustion
Estimated Reading Time: 2 minutes
Don’t invest unless you’re prepared to lose all the money you invest. This is a high-risk investment and you are unlikely to be protected if something goes wrong. Take 2 minutes to learn more

XRP (XRP) Long-Term Analysis: Bearish
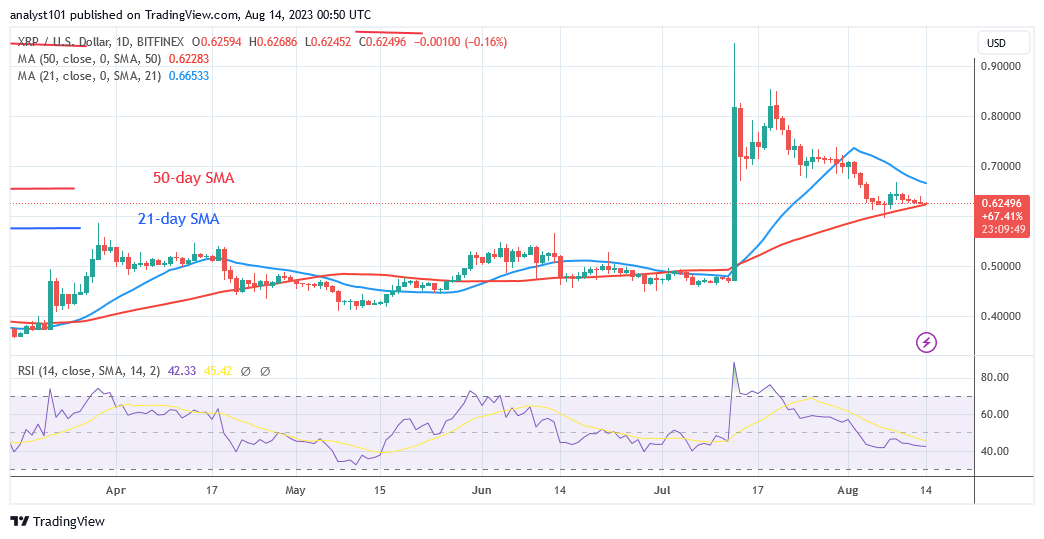
XRP (XRP) price consolidates above $0.59 support as it reaches bearish exhaustion. The present downward trend has achieved bearish fatigue. The cryptocurrency asset is trading above the 50-day simple moving average but below the 21-day simple moving average.
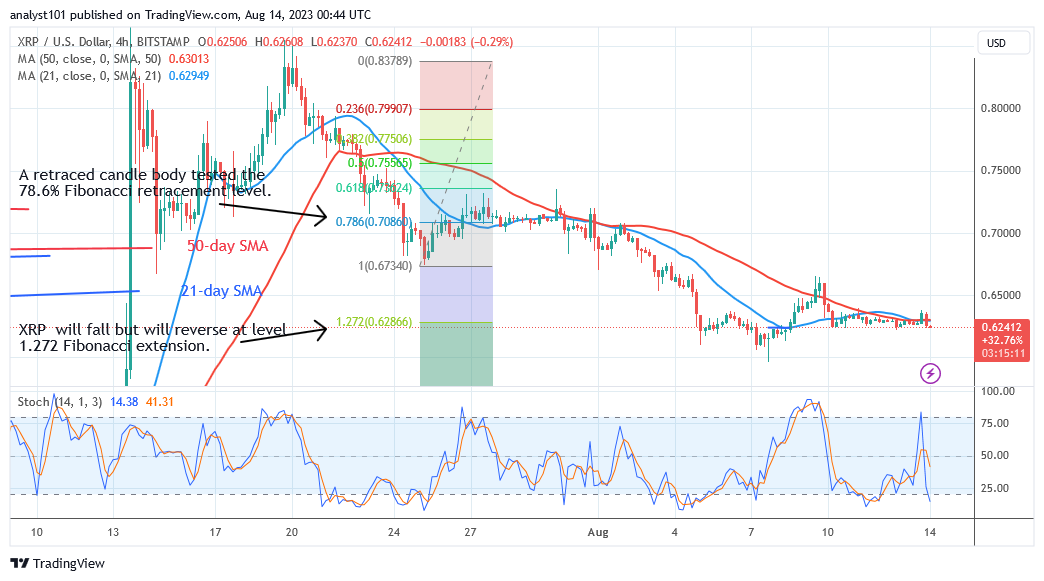
XRP has been caught between the moving average lines since July 31. If the current support or the 50-day SMA holds, the market will rise and break above the 21-day SMA. The coin will rise to its prior high of $0.85. The market would decline if the 50-day SMA or current support were to be violated. The altcoin will decline and retest the $0.47 level.
In the meantime, the cryptocurrency is caught between the moving average lines.
Technical Indicators
Major Resistance Levels – $1.00, $1.50, $2.00
Major Support Levels – $0.50, $0.30, $0.10
XRP(XRP) Indicator Analysis
For period 14, XRP is declining at Relative Strength Index level 43. The coin is currently in a bearish trend zone and has hit bearish exhaustion. The price bars are positioned between the moving average lines, indicating a potential range-bound move. XRP is in a negative trend below the daily Stochastic threshold of 50.
What Is the Next Direction for XRP (XRP)?
XRP has remained above 50-day SMA as it reaches bearish exhaustion. Doji candlesticks characterize the price activity, leading the altcoin to trade modestly. The market’s path has not been determined by buyers and sellers. The current price movement could result in a price breakdown or a price rebound.
You can purchase crypto coins here. Buy LBLOCK
Note: Cryptosignals.org is not a financial advisor. Do your research before investing your funds in any financial asset or presented product or event. We are not responsible for your investing results