Lucky Block Price Prediction: LBLOCK/USD Soars Above $0.0010 Level
Estimated Reading Time: 2 minutes
Don’t invest unless you’re prepared to lose all the money you invest. This is a high-risk investment and you are unlikely to be protected if something goes wrong. Take 2 minutes to learn more

Free Crypto Signals Channel
The Lucky Block price prediction hovers around the $0.0011 level as the market price moves to cross above the channel.
LBLOCK/USD Long-term Trend: Ranging (12H Chart)
Key Levels:
Resistance levels: $0.0018, $0.0020, $0.0022
Support levels: $0.0004, $0.0003, $0.0002
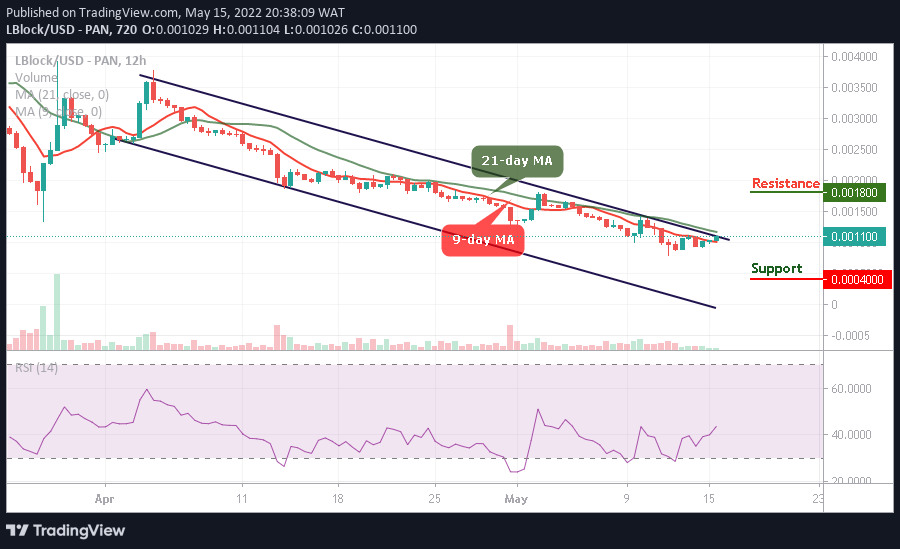
LBLOCK/USD is trading around $0.0011 as the bulls push the coin above the 9-day moving average. However, the current trend suggests a growth momentum in the next positive direction. Meanwhile, buyers are expected to invest more as a bullish movement is coming to play out.
Lucky Block Price Prediction: Would LBLOCK/USD Push to the Upside?
The Lucky Block price will continue to experience an increase in volume as the coin faces the upside. On the contrary, if the coin delays its bullish movement, the bears may revisit the market with more downs for the new investors to come into the market. However, the next level of support lies at $0.0004, $0.0003, and $0.0002.
According to the 12-hour chart, the Lucky Block price will move bullishly as the technical indicator Relative Strength Index (14) moves to cross above 45-level. However, any further bullish movement will hit the potential resistance levels at $0.0018, $0.0020, and $0.0022.
LBLOCK/USD Medium-term Trend: Ranging (2H Chart)
Looking at the 4-hour chart, the Lucky Block price is moving to cross above the upper boundary of the channel as the coin heads to the north. Therefore, should the price break above the channel, the market price could touch the resistance level at $0.0014 and above.
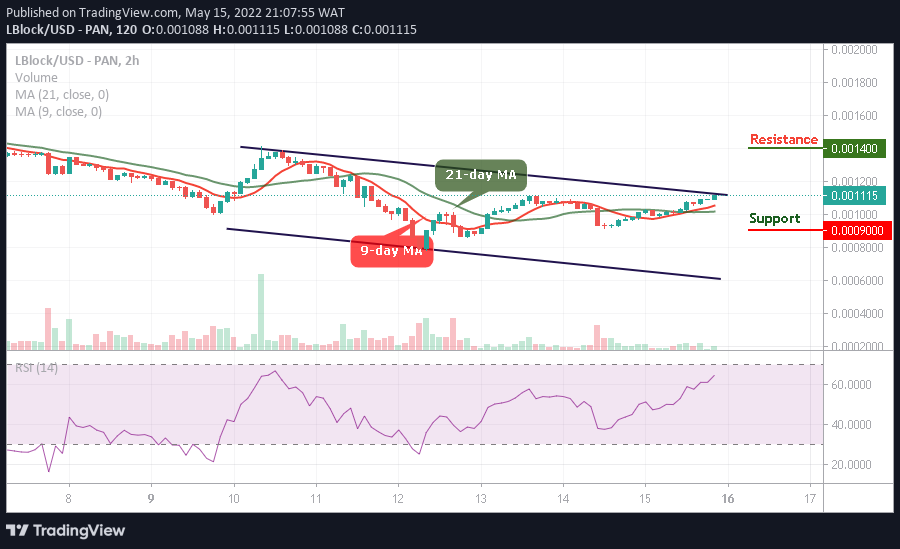
On the contrary, the Lucky Block price may retreat and cross below the 9-day and 21-day moving averages to hit the support at $0.0009 and below for more buyers to come into the market. However, the technical indicator Relative Strength Index (14) moves to cross above 70-level, suggesting more bullish signals.
You can purchase Lucky Block here. Buy LBlock