Cardano Is in a Sideways Move as It Hits the $0.46 High
Estimated Reading Time: 2 minutes
Don’t invest unless you’re prepared to lose all the money you invest. This is a high-risk investment and you are unlikely to be protected if something goes wrong. Take 2 minutes to learn more
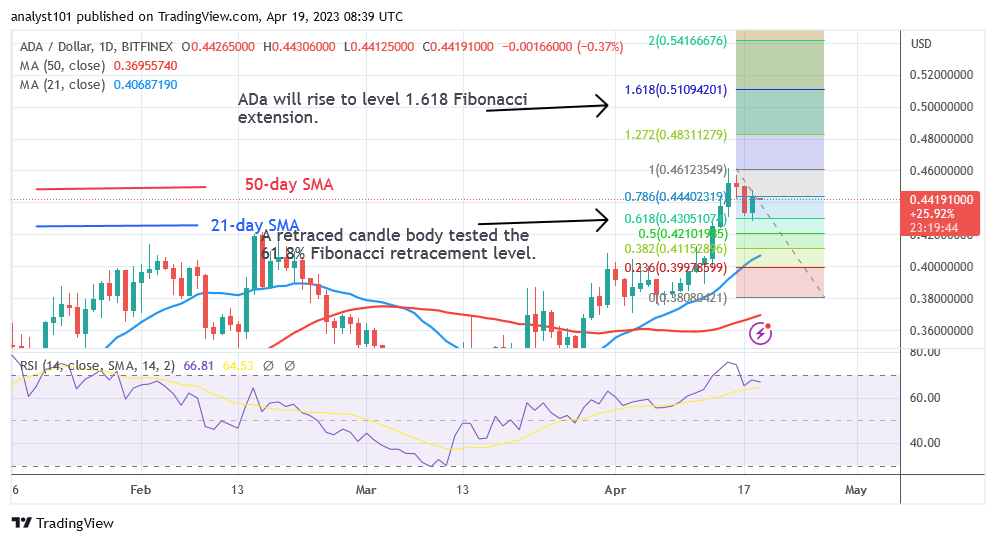
Cardano (ADA) Price Long-Term Forecast: Bullish
Cardano (ADA) price is in a range as it hits the $0.46 high. It is anticipated that the upward trend will continue if the price moves past the first resistance level at $0.46. The cost of ADA was $0.44 at the time of publication. On April 16, the cryptocurrency was rejected as it hits the overbought zone. In the interim, the April rally’s retraced candle body tested the 61.8% Fibonacci retracement line. The retracement indicates that ADa will rise to level 1.618 of the Fibonacci extension, or $0.51. Based on price movement, the coin is rising to retest or pass through the current resistance level.
Cardano (ADA) Indicator Analysis
On the Relative Strength Index for period 14, Cardano is at level 66. Before moving back to the bullish trend zone, the coin was earlier in the overbought range. The price bars are significantly higher than the moving average lines, which has caused the price to soar. Above the daily stochastic’s level of 40, there is a slowing of the bullish momentum.
Technical indicators:
Major supply zones: $1.0, $1.05, $1.10
Major demand zones: $0.45, $0.40, $0.35
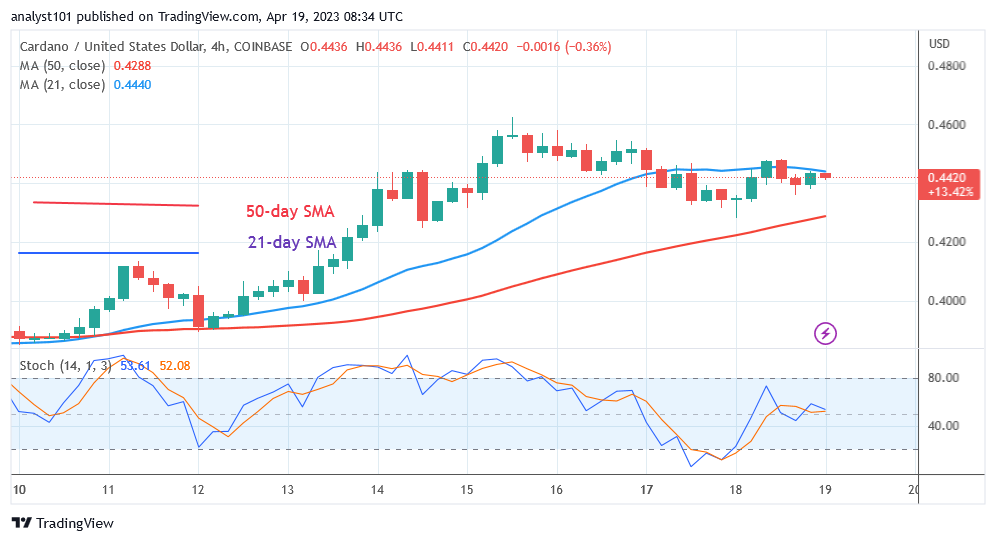
What Is the Next Move for Cardano (ADA)?
Cardano’s upward move is doubtful as it hits the $0.46 high on April 15. On the 4-hour chart, the cryptocurrency has dropped between the moving average lines. This implies that the coin will be compelled to move sideways in between the moving average lines. How far the price will move depends on whether the moving average lines are broken.
You can purchase crypto coins here. Buy LBLOCK
Note: Cryptosignals.org is not a financial advisor. Do your research before investing your funds in any financial asset or presented product or event. We are not responsible for your investing results