UMA (UMAUSD) Keeps Falling Under Bearish Pressure
Estimated Reading Time: 3 minutes
Don’t invest unless you’re prepared to lose all the money you invest. This is a high-risk investment and you are unlikely to be protected if something goes wrong. Take 2 minutes to learn more
UMA Analysis – Price Keeps Falling and Making Lower Lows and Highs
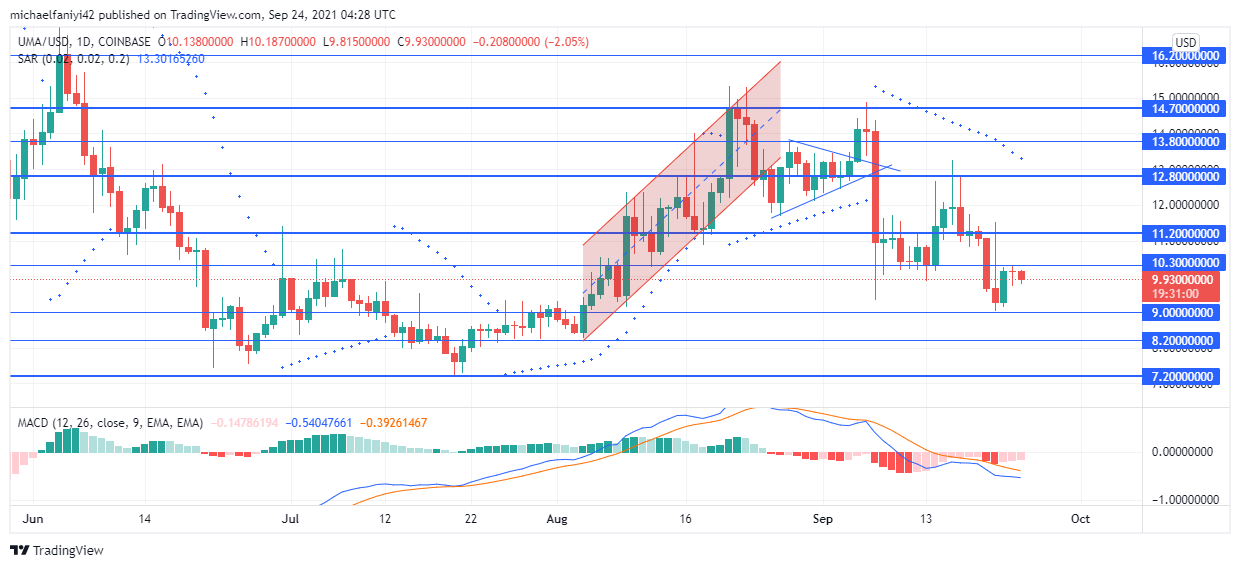
UMA keeps falling and remains in a downtrend, and bearish pressure weighs in strongly on the market. Bears started applying pressure to the market immediately after the price reached the $14.700 key level. The September 7th price drop, in particular, triggered the downtrend for UMA as it plummeted the market below $10.300. The coin has been trying to recover since, but its best effort took it to $12.800 where it made a lower high before dropping again.
UMA Important Levels
Resistance Levels: $10.300, $11.200, $12.800
Support Levels: $9.000, $8.200, $7.200
From $12.800, the price fell again, falling past $11.200 to $9.000. The last time the market was at this level was when it was recovering from a serious dip. After much struggle, it climbed to this level and retested it to push up and spark an uptrend that eventually took the market to $14.700. However, currently, on the daily chart, the price keeps falling and is seen to consistently make a lower low and a lower high.
The $9.000 key level could be a point at which the price makes a comeback or falls even further. At present, the odds are stacked against the rise of the market. The Parabolic SAR (Stop and Reverse) has its dots lined up above the market from the September 7th drop till today, which shows a generally falling market. The MACD (Moving Average Convergence Divergence) indicator has its line below the zero level and with accompanying bearish histogram bars.

Market Anticipation
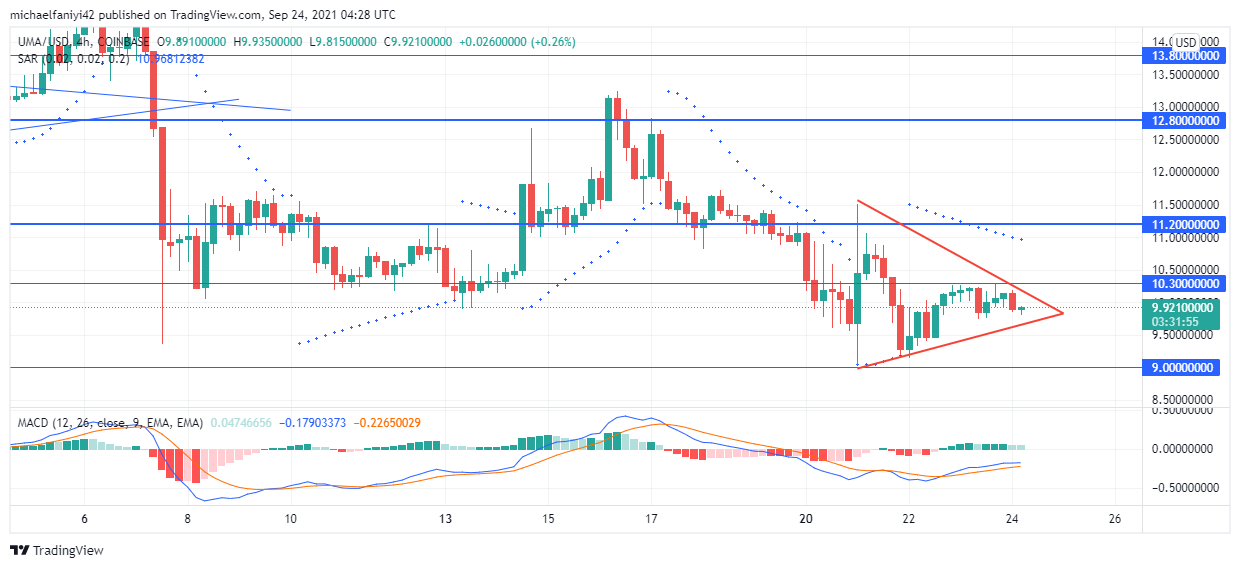
There are some encouraging indications for the buyers on the 4hour chart. The bulls are not employing a triangle pattern to spark a revival in the market. This is confirmed by the MACD indicator. Its lines are still below the zero level, but they are ascending. The histogram bars have switched to bullish ones. It remains to be seen if the bulls can sustain this momentum. If it is successful, the price will breakout upward to climb above the $11.200 level, before it makes more effort to climb upwards.
You can purchase crypto coins here: Buy Tokens
Note: Cryptosignals.org is not a financial advisor. Do your research before investing your funds in any financial asset or presented product or event. We are not responsible for your investing results.