Bitcoin (BTC/USD) Market Fluctuates Above $45,000
Estimated Reading Time: 3 minutes
Don’t invest unless you’re prepared to lose all the money you invest. This is a high-risk investment and you are unlikely to be protected if something goes wrong. Take 2 minutes to learn more
Bitcoin Price Prediction – January 5
There has been a continual less-active motion in the BTC/USD trade operations as the crypto-economic market fluctuates nearly above $45,000. Today’s business activity has witnessed a higher value-line of about $46,612 and a lower value-line of around $45,728 at a percentage rate of about 0.53 positive.
BTC/USD Market
Key Levels:
Resistance levels: $50,000, $52,500, $55,000
Support levels: $45,000, $42,500, $40,000
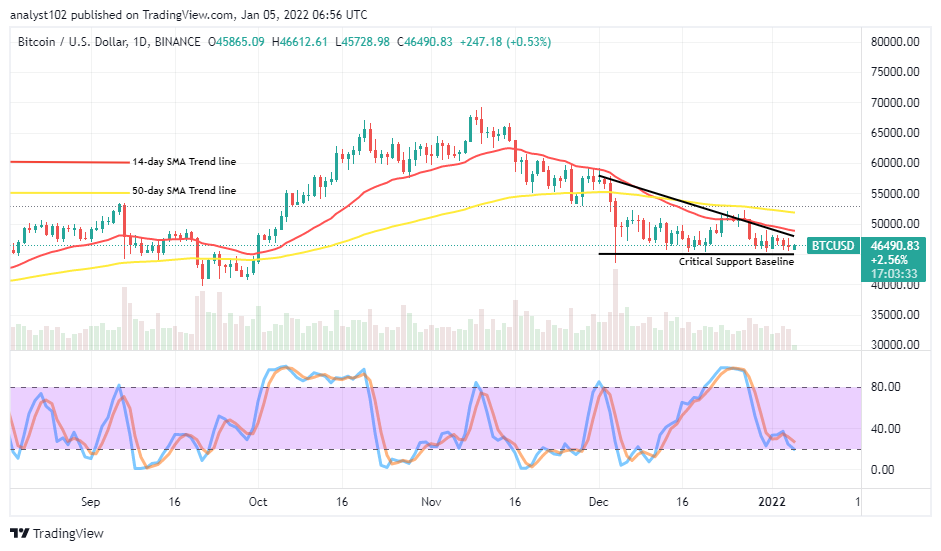
BTC/USD – Daily Chart
The BTC/USD daily chart showcases that the crypto-economic market fluctuates nearly above $45,000. There has been a series of candlesticks trying to bottom close to the value line. The bearish trend line drew southward alongside the smaller SMA trend line in a supportive style. The 50-day SMA indicator is above the 14-day SMA indicator. The Stochastic Oscillators have moved southbound from the range at 40 to touch a range of 20. And a smaller bullish candlestick is in the making to indicate the crypto is struggling to surge for a catalyst against the US Dollar.
Will breaking down at the $45,000 critical support baseline portend a reliable signal of getting more lows subsequently as the BTC/USD market fluctuates near above it?
It seemingly appears that the BTC/USD trade operations have been consolidating beneath the trend lines of the SMAs and, that could in the long-term give way for a significant fearful breakdown at the $45,000 critical support baseline as the market fluctuates near above it. On the contrary, a retest of that value line in the bid of downing will potentially give back the crypto energy to push northward afterward.
On the downside of the technical analysis, the BTC/USD market short-position takers have to patiently be on the lookout for a fearful reversal of an upward movement beneath the trend line of the 14-day SMA before considering exerting a sell order. Elongation of a sudden southward motion against the critical support baseline drew, may in the first place, experience dicey swinging trading conditions. Traders should be wary of their positions opening during such situations if eventually plays as presumed.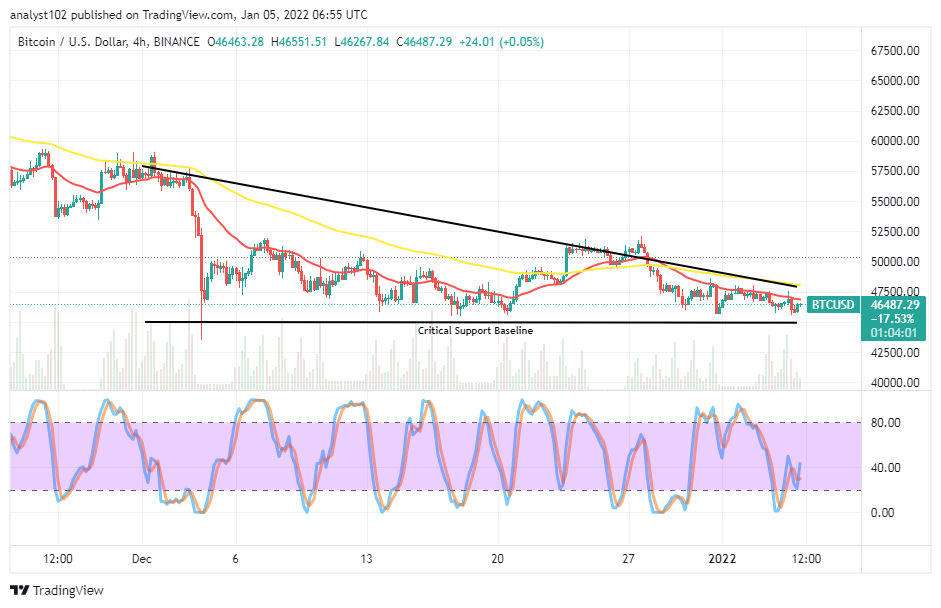
BTC/USD 4-hour Charts
The BTC/USD medium-term chart exhibits that the crypto market fluctuates nearly above $45,000 as variant candlesticks are emerging alongside the trend line of the smaller SMA to the south side. The 50-day SMA indicator is above the 14-day SMA indicator. And, a kind of head and shoulders pattern has formed in the triangular shape that has made the crypto economy gets its critical support baseline drawn at the value line mentioned earlier. The Stochastic Oscillators are now trying to point northbound against the range of 40. That signifies that the US Dollar may lose momentums to BTC for a while.
Note: Cryptosignals.org is not a financial advisor. Do your research before investing your funds in any financial asset or presented product or event. We are not responsible for your investing results.
You can purchase crypto coins here. Buy Tokens