Ripple Falls and Bounces Above Level $1.12, Uptrend Likely
Estimated Reading Time: 2 minutes
Don’t invest unless you’re prepared to lose all the money you invest. This is a high-risk investment and you are unlikely to be protected if something goes wrong. Take 2 minutes to learn more
Ripple (XRP) Long-Term Analysis: Bullish
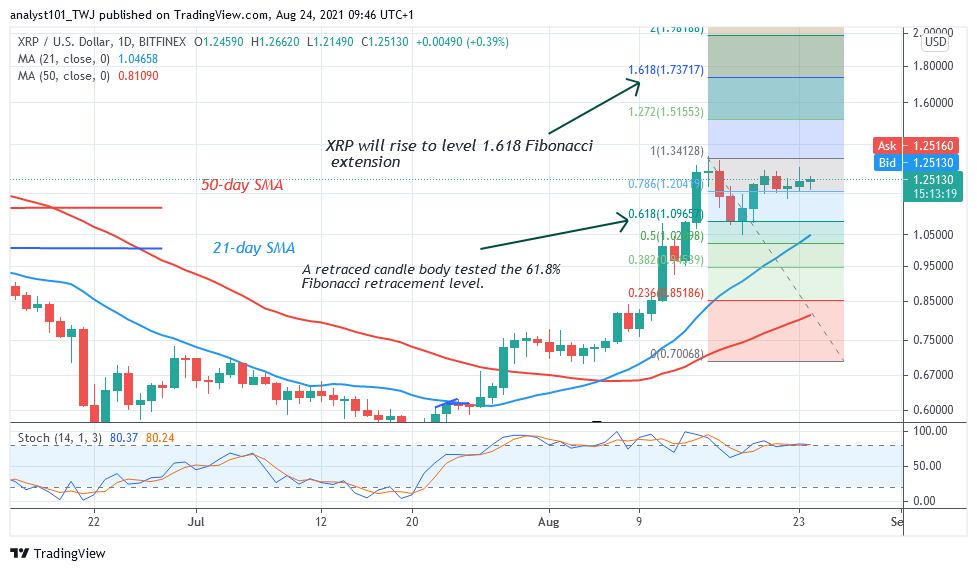
Today, Ripple’s (XRP) price is retracing after failing to break above the $1.30 resistance. Ripple has earlier attained the high of $1.34 but could not continue will bullish momentum above the recent high. For the past week, the crypto has been in a downward correction. The retracement may have subsided as it reached the low of $1.12. In the previous retracement, the market reached a low of $1.0867. The uptrend is likely to resume once the resistance at $1.34 is breached. Meanwhile, on August 15 uptrend; a retraced candle body tested the 61.8% Fibonacci retracement level. The retracement indicates that XRP will rise to level 1.618 Fibonacci extension or level $1.73.
.Ripple (XRP) Indicator Analysis
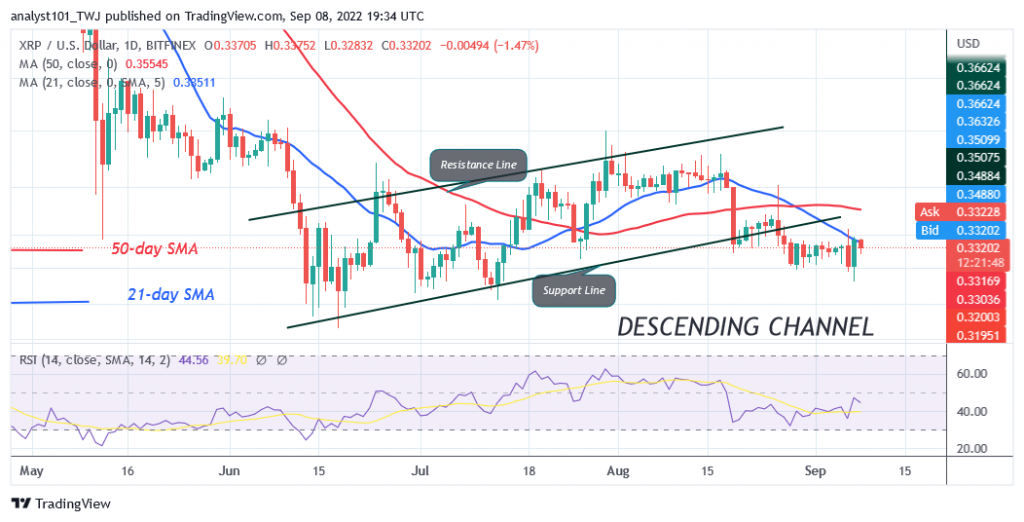
The altcoin is at level 61 of the Relative Strength Index period 14. It indicates that XRP is in the bullish trend zone and capable of rising on the upside. Ripple is above the 25% range of the daily stochastic. It indicates that the market is in a bullish momentum. The 21-day and the 50-day SMA are sloping upward.
Technical indicators:
Major Resistance Levels – $2.00, $2.50, $3.00
Major Support Levels – $1.50, $1.00, $0.50
What Is the Next Direction for Ripple (XRP)
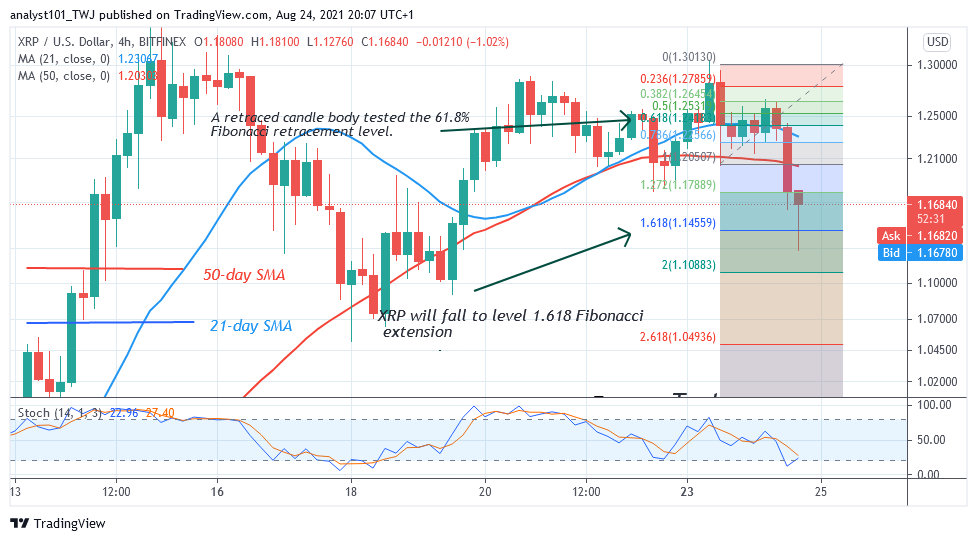
Ripple downtrend may have subsided as we expected the upward movement of the coin. . Meanwhile, on August 23 downtrend; a retraced candle body tested the 61.8% Fibonacci retracement level. The retracement indicates that XRP will fall to level 1.618 Fibonacci extension or level $1.14. From the price action, the market reached the low of $1.12 and pulled back.
You can purchase crypto coins here. Buy Tokens
Note: Cryptosignals.org is not a financial advisor. Do your research before investing your funds in any financial asset or presented product or event. We are not responsible for your investing results