Litecoin (LTC/USD) Market Builds on $60, Conjecturing Bounces
Don’t invest unless you’re prepared to lose all the money you invest. This is a high-risk investment and you are unlikely to be protected if something goes wrong. Take 2 minutes to learn more

Litecoin Price Prediction – October 18
Buyers’ strength has been centered around the lower range line as the sellers have staged retardation input around the resistance spot of $70 in the business activities of Litecoin versus the US Dollar, given that the crypto-economic market builds on the line of $60, conjecturing bounces over time from the area.
The two areas of competing trade points are currently seen around the price points of $70 and $60. The general conclusion is that long-position takers should leverage any buying pressure within and around the depicted values in order to accumulate more points, as bears are on the verge of losing out to a variety of returns from high swings that could result in increases over the long term.
LTC/USD Market
Key Levels:
Resistance levels: $70, $75, $80
Support levels:$55, $50, $45
LTC/USD – Daily Chart
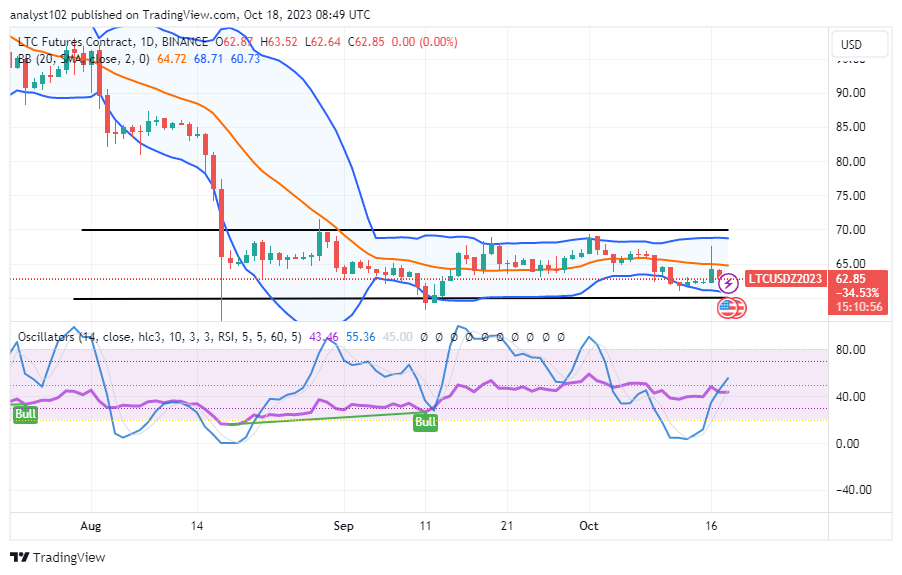
The LTC/USD daily chart reveals the crypto-economic trade builds on the level of $60, conjecturing bounces from that transaction axis.
The positional values of the Bollinger Band trend lines are placed at $68.71, $64.72, and $60.73, respectively, in an effort to showcase the confirmation signals to the range-bound spots of $70 and $60. The stochastic oscillators have managed to cross back northbound from the oversold region, ranging from 43.46 to 55.36.
If the price tends to move lower, would it be technically optimal for bears to follow the lower Bollinger Band trend line’s downward trajectory in the LTC/USD market?
It would amount to an unethical trade approach for the LTC/USD market sellers to go along the path of the lower Bollinger Band trend line as the cryptocurrency trade builds on the line of $60, conjecturing bounces from the point identified.
Over the course of a few days, buyers have been finding support from the lower and middle Bollinger Bands, resulting in recoveries that will eventually open the door for a push outside of the current range-bound zones. Variant buy locations must be engaged based on the present price value.
Buyers will have to expend effort toward generating a stable, aggressive breakout against the point of $70 later on in order to analyze the probability of witnessing decreases in the line of this crypto economy. Prior to thinking about taking a step in the direction of shortening order, it is equally preferable to have the circumstances demonstrate an overbought atmosphere.
LTC/BTC Price Analysis
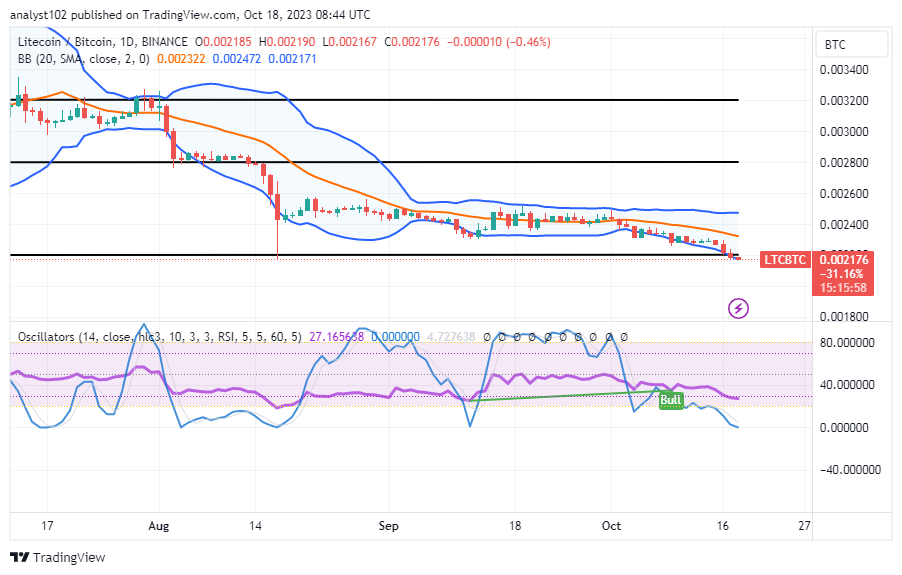
In contrast, the Litecoin trade continues to trend slowly and steadily along the line of the lower Bollinger Band against the valuation of Bitcoin, conjecturing bounces even in the wake of that trade input.
The bottom Bollinger Band trend line has been made to stretch somewhat southward as of the writing of this technical analysis piece, and the middle portion is prone to briefly bending south because the upper line is currently pointing more east than any other way. The positions of the stochastic oscillators range from 27.165638 to 0.000000. This shows that the quotient cryptocurrency has advanced to significant milestones where it will be unable to advance freely against the base trading instrument in the upcoming session.
Note: Cryptosignals.org is not a financial advisor. Do your research before investing your funds in any financial asset or presented product or event. We are not responsible for your investing results.
You can purchase Lucky Block here. Buy LBLOCK


