Solana (SOL/USD) Price Is in an Extreme State, Lacing More Ups
Estimated Reading Time: 3 minutes
Don’t invest unless you’re prepared to lose all the money you invest. This is a high-risk investment and you are unlikely to be protected if something goes wrong. Take 2 minutes to learn more
Solana Price Prediction – July 7
The Solana price is in an extreme state, lacing more ups against the market power of the US economy.
At the moment of this technical piece, long-position placers have been muscling catalysts as they have produced trade value points to zone between $20.52 and $19.45, keeping a positive percentage rate of 3.11. Due to its tendency to keep values rising, purchasers may need to make a small adjustment in order to get enough strength to push over its most recent high, which is close to the $17.50 mark.
SOL/USD Market
Key Levels:.
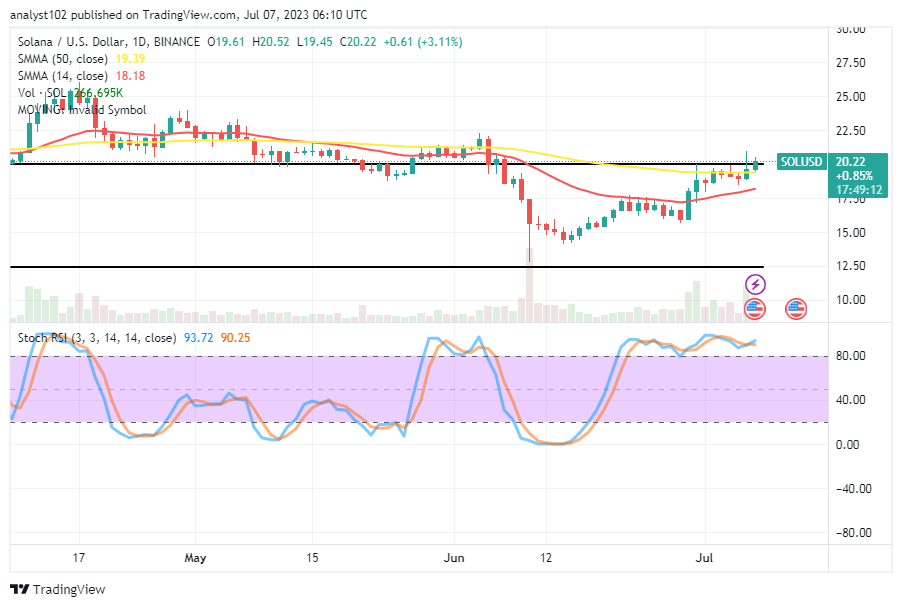
Resistance levels: $22, $24, $26
Support levels: $18, $16, $14
SOL/USD – Daily Chart
The SOL/USD daily chart showcases the crypto-economic price is in an extreme state, lacing more ups beyond its current overbought condition.
The 14-day SMA indicator has strived to curve northward at $18.18, beneath the $19.39 value point of the 50-day SMA indicator. The formation of variant candlesticks has been made to affirm the possibility of breaking through the resistance at a slow pace. The Stochastic Oscillators have continued to position northbound from 90.25 to 93.72 levels.
Will a scenario where a bearish candlestick appears across the SMA trend lines be sufficient to indicate that falls will resume?
A repositioning of the 14-day SMA trend line closely below the trend line of the 50-day SMA with a lengthy bearish candlestick crossing them to the downside will portend a firm sell signal, holding that the SOL/USD market is in an extreme state, lacing more ups.
As there has been an overbought condition in the market, the consolidation moving order process has to start now for buyers. More buying orders added to the trade volume around the key $20 will generate increases.
On the southward-moving method, bears are to brace up to spot any loophole that can lead to complete exhaustion of buying sprees around the resistances set up above. Short-position placers would need an aggressive move to the south side at the touch of resistance over the current trade axis of $20.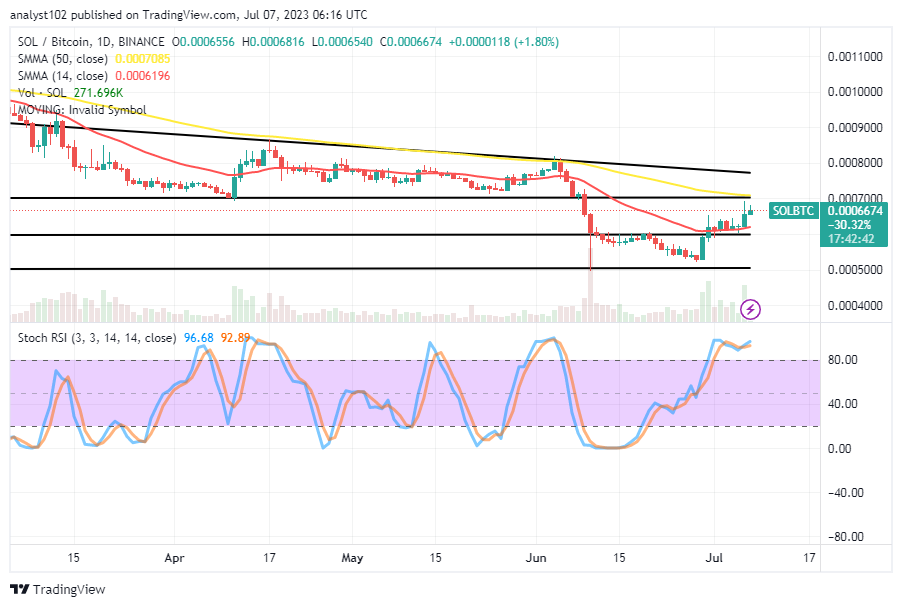
SOL/BTC Price Analysis
Contrasting Solana’s trending capacity with Bitcoin’s, the former is now trading in an extreme state, lacing more ups toward the trend line of the bigger indicator.
During Thursday’s 29th session, a formidable bullish candlestick propelled a change toward getting increases along the path of the Japanese stick at the higher point. The Stochastic Oscillators are pointing northward from 92.89 to 96.68 levels and are situated in the overbought area. The base cryptocurrency will eventually hit a higher psychological point than the larger SMA if it continues to consolidate its positions. A retracement of the current course is urgently needed.
Note: Cryptosignals.org is not a financial advisor. Do your research before investing your funds in any financial asset or presented product or event. We are not responsible for your investing results.
You can purchase Lucky Block here. Buy LBLOCK