Solana (SOL/USD) Price Holds a Reduction Index, Slowing Actions
Estimated Reading Time: 3 minutes
Don’t invest unless you’re prepared to lose all the money you invest. This is a high-risk investment and you are unlikely to be protected if something goes wrong. Take 2 minutes to learn more
Solana Price Prediction – June 30
The Solana’s price holds a reduction index, slowing actions closely below the resistance trade line of $20.
Gradually, the depression weight has been returning to signify that bears are taking a lead in the price pushes between maximal and minimal value points of $19.01 and $17.91, maintaining a percentage pace of 3.13 negatives. A line of slow motions could also play alongside the current shifts in valuation, not too far below the resistance line for a while. But the overriding transaction sentiment remains that buyers should be wary of launching a comeback against the $20 zone.
SOL/USD Market
Key Levels:.
Resistance levels: $20, $23, $26
Support levels: $15, $12.50, $10
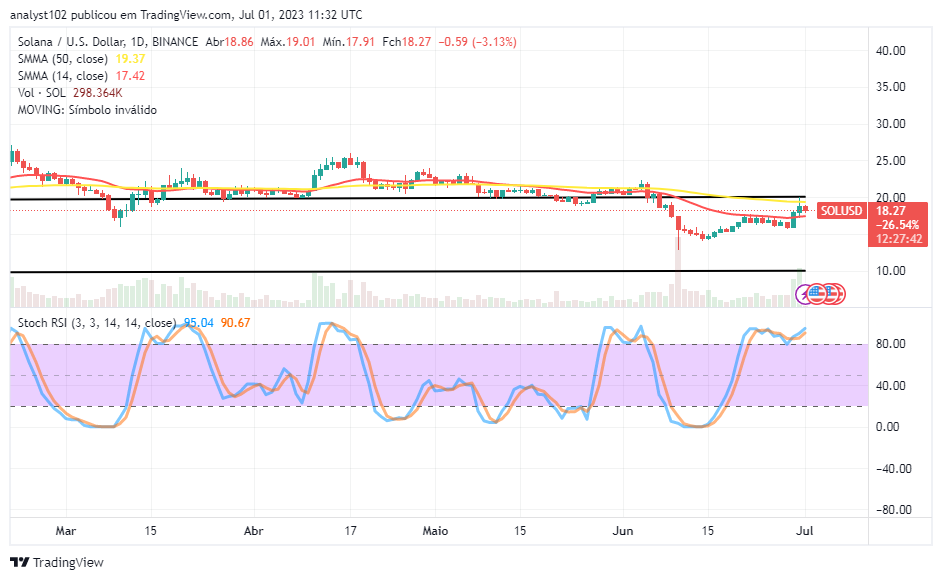
SOL/USD – Daily Chart
The SOL/USD daily chart showcases that the crypto-economic the crypto rice holds a reduction index, slowing actions of intensifying below the upper horizontal line at $20.
The 50-day SMA indicator is at $19.37 points above the $17.42 value line of the 50-day SMA indicator. The lower horizontal line is drawn at $10 to mark the minimum point of the current range of trade zones. The Stochastic Oscillators are positioned from 90.67 to 05.04 to indicate that price has obtained some degrees of the highest point of capacity to move northward very well with probable signs of hindrances afterward.
Will the SOL/USD market activity alter direction from the current trading position in the direction of breaking the resistance at $20?
An angle of technicality has suggested that the current level of the SOL/USD market has reached an overbought state that might not witness a quick further breakthrough of the $20 resistance as the crypto-economic price holds a reduction index, slowing actions in the process.
A bullish path has set up alongside the formation of a candlestick that occurred during the 29th session. Therefore, buyers are to get strategic around the length of the market position while price action tends to surface in the northward direction to take advantage of a longing order without wasting time.
On the southward moving mode, at the present, there has been a sign of a downtrending force to make a way for a decent shorting entry at a low-active motion below the $20 resistance line. Sellers might have to add more effort to their position retaking system by ensuring that no price action is allowed to surge suddenly past the point in no time.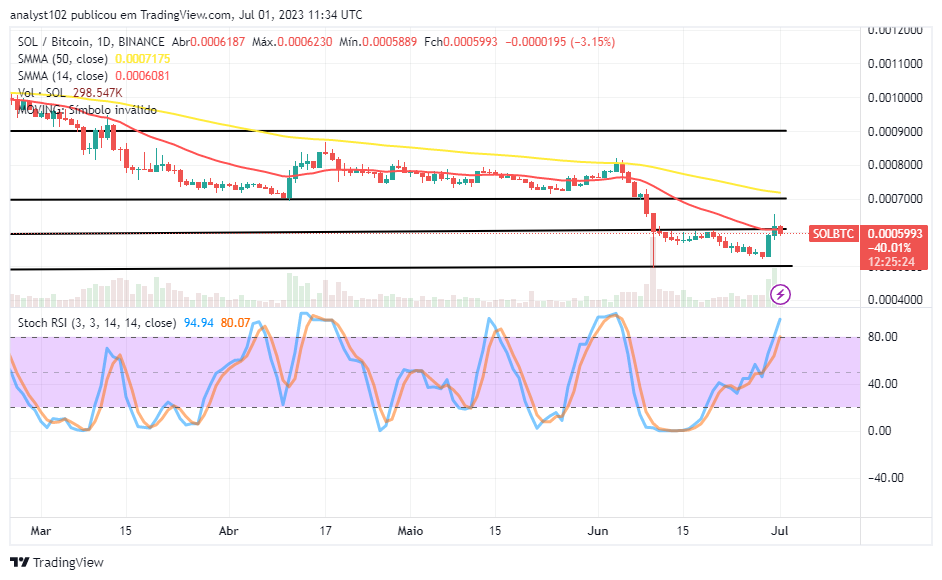
SOL/BTC Price Analysis
Contrasting the pushing ability of Solana with Bitcoin, a bullish candlestick has emerged and relatively peaked around the trend line of the smaller indicator, making the pairing crypto price hold a reduction index, slowing actions.
The 50-day SMA trend line is above the 14-day SMA trend line, maintaining a southward position over the trading candlestick. The Stochastic Oscillators have traversed northbound from the oversold region to places between 80.07 and 94.94 levels. Going by that condition, the base crypto is likely to debase soon in a way before it can recoup its stances afterward.
Note: Cryptosignals.org is not a financial advisor. Do your research before investing your funds in any financial asset or presented product or event. We are not responsible for your investing results.
You can purchase Lucky Block here. Buy LBLOCK