LBLOCK/USD Price Prediction: Lucky Block Looks Good at $0.000155
Estimated Reading Time: 3 minutes
Don’t invest unless you’re prepared to lose all the money you invest. This is a high-risk investment and you are unlikely to be protected if something goes wrong. Take 2 minutes to learn more
Lucky Block Price Prediction – June 24
The Lucky Block price prediction shows that the bulls will begin to increase their momentum, and the price will head to the upside.
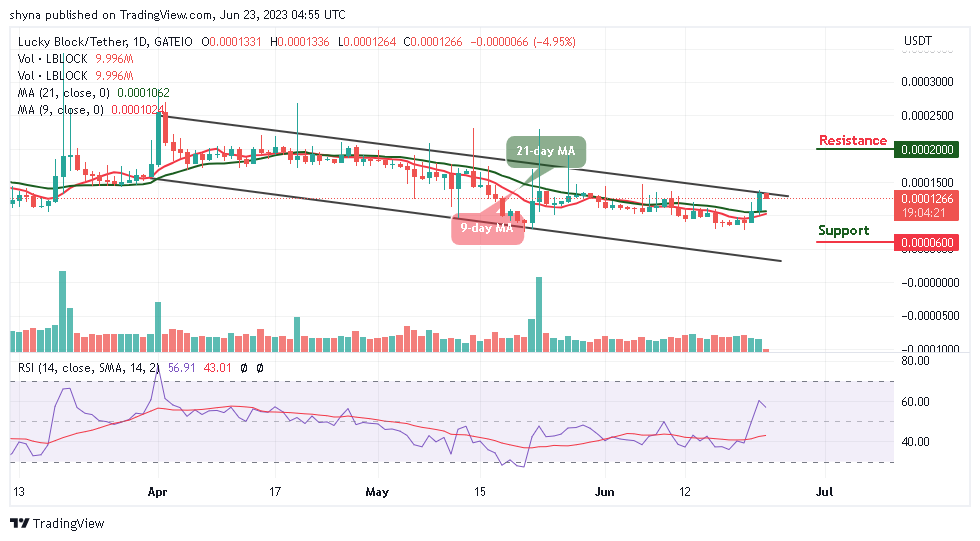
LBLOCK/USD Medium-term Trend: Ranging (1D Chart)
Key Levels:
Resistance levels: $0.000200, $0.00220, $0.000240
Support levels: $0.000060, $0.000040, $0.000020
LBLOCK/USD is moving sideways as the coin trades above the 9-day and 21-day moving averages. However, the bullish momentum is coming to play in the market soon, and the bullish pressure could break the $0.000150 level. Moreover, if the bulls fail to drive the price higher, the Lucky Block price could consolidate within a little time before heading to the north.
Lucky Block Price Prediction: LBLOCK/USD Could Face the Upside
The Lucky Block price is at the time of writing, hovering at $0.000154 where it could make a cross above the 9-day and 21-day moving averages. However, if the coin crosses above the upper boundary of the channel, it will locate the potential resistance levels at $0.000200, $0.000220, and $0.000240 while the support levels could be found at $0.000060, $0.000040, and $0.000020 for new buyers to come into the market. Meanwhile, the technical indicator Relative Strength Index (14) stays above the 50-level, preparing the coin for the upside.
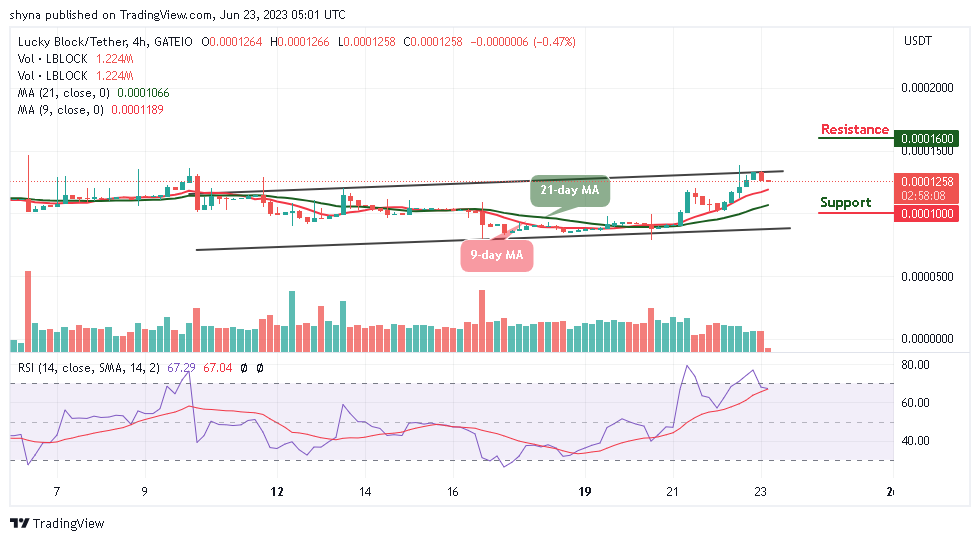
LBLOCK/USD Medium-term Trend: Ranging (4H Chart)
According to the 4-hour chart, the Lucky Block price will spike to the upside as soon as it crosses above the 9-day moving average. The technical indicator Relative Strength Index (14) is likely to cross above the 60-level as the coin prepares for upward movement. Any bullish movement above the upper boundary of the channel could reach the resistance level at $0.000160 and above.
However, LBLOCK/USD will begin to display some bullish signals immediately after the sideways movement, and once this happens, the market price will head to the upside, but if the price drops and slides toward the lower boundary of the channel, it could touch the nearest support at $0.000100 and below.
You can purchase Lucky Block here. Buy LBLOCK