Binance Coin (BNB) Retraces to $372 Low, Risks Further Decline Below $380
Estimated Reading Time: 2 minutes
Don’t invest unless you’re prepared to lose all the money you invest. This is a high-risk investment and you are unlikely to be protected if something goes wrong. Take 2 minutes to learn more

Binance Coin (BNB) Long-Term Analysis: Bearish
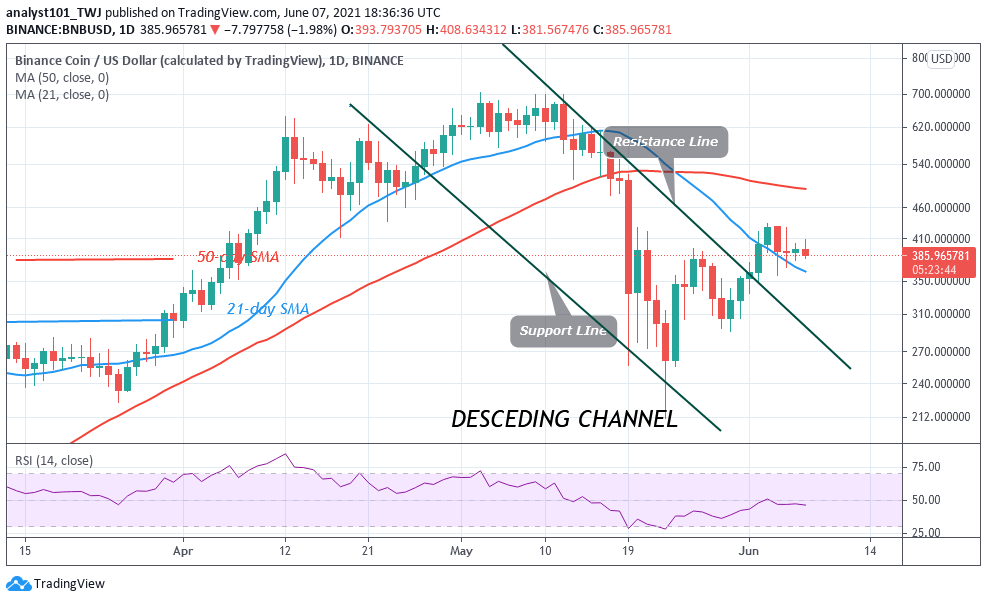
On May 24, Binance Coin recovered above the $250 support and rallied to the previous highs. The uptrend is facing resistance at the $420 high. The coin is likely to continue its rise as it breaks above the resistance line and the 21-day SMA. BNB price is retracing to the support above 21-day SMA. The market will resume upward if price finds support above the SMAs.
Binance Coin (BNB) Indicator Analysis
BNB has risen to level 46 of the Relative Strength Index period 14. It indicates that the altcoin is in the downtrend zone and below the centerline 50. BNB is below the 40% range of the daily stochastic. It indicates that BNB/USD is in a bearish momentum. The crypto has a bearish crossover as the 21-day SMA crosses above the 50-day SMA.

Technical indicators:
Major ResistancIs ie Levels – $640, $660, $680
Major Support Levels – $540, $520, $500
What Is the Next Direction for Binance Coin (BNB)?
Binance Coin is in a downward move after the rejection at the $420 high. The Fibonacci tool has indicated a further downward movement of the coin. Meanwhile, on June 5 downtrend; a retraced candle body tested the 78.6% Fibonacci retracement level. The retracement indicates that the coin will fall and reverse at level 1.272 Fibonacci extension or a level of $372.19.

Note: new.cryptosignals.org is not a financial advisor. Do your research before investing your funds in any financial asset or presented product or event. We are not responsible for your investing results