Cardano (ADA/USDT) Shows Early Signs of a Potential Reversal
Estimated Reading Time: 3 minutes
Don’t invest unless you’re prepared to lose all the money you invest. This is a high-risk investment and you are unlikely to be protected if something goes wrong. Take 2 minutes to learn more
Cardano Long-term Analysis: Bullish
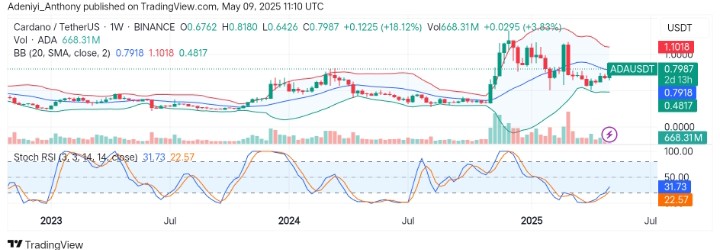
After months of sideways movement and a significant drop from the recent highs, Cardano against the Tether is beginning to press above the dynamic level of the Bollinger Bands, hinting at a possible trend reversal.
Recently, Cardano has caught the attention of traders, posting a strong weekly candlestick, recording more than a 18% gain with increased bullish participation as the market alone sees over 668 million traded volumes.
Currently, Cardano trades at $0.7987, hinting at growing trader interest and a potential move to the north.
Technical Indicators
Major Resistance Levels: $0.9300, $1.2000, and $1.5000
Major Support Levels: $0.7918, $0.6400, and $0.4817
Cardano Technical Analysis
The analysis for Cardano against the Tether on the weekly timeframe shows the pair is riding on the wave of renewed bullish interest as the pair creates a little margin above the midline of the Bollinger bands. However, more moves above the dynamic $0.79180 in the near term would strengthen the trajectory to the north.
From another view, the Stochastic RSI suggests the pair is on an early reversal plan as the lines curl upside from an oversold region, with the increasing volume indicating bullish support.
To this end, a sustained move above $0.8000 in this session would increase the likelihood of breaking above $1.0000 shortly.
ADA/USDT Analysis: Where from Here?
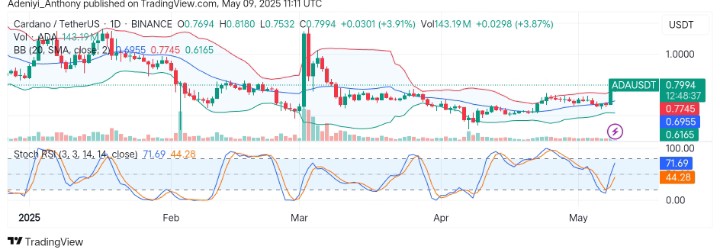
On the daily chart, ADA/USDT appears to be trading slightly above the upper segment of the Bollinger Bands, suggesting an overbought market but a display of bullish confidence. The pair has seen an aggregate volume of over a hundred with more than 3% solid gain. However, as the volume increases with the potential expansion of the bands, it is expected that the bulls are going to set a new high.
From another angle, the Stochastic RSI signals a near overbought condition, hinting at a potential pullback if the price extends further to the north. If momentum is sustained, ADA/USDT could attempt a move above the $0.9000 level before the close of the day.
You can purchase crypto coins here. Buy LBlock