Solana (SOL/USD) Market Continues to Hover Around $20
Estimated Reading Time: 3 minutes
Don’t invest unless you’re prepared to lose all the money you invest. This is a high-risk investment and you are unlikely to be protected if something goes wrong. Take 2 minutes to learn more
Solana Price Prediction – March 31
The SOL/USD market continues to hover around $20, owing to an indecision-trading manner that is outplaying between the two market movers. The activities have produced more negativities than positives as the price trades at a 1.36 percentage rate to the downside at the $20.26 trading point. That suggests that it will take some time for purchasers’ reactions to change so that lost value recoveries can occur.
SOL/USD Market
Key Levels:
Resistance levels: $25, $27.50, $30
Support levels: $17.50, $15, $12.50
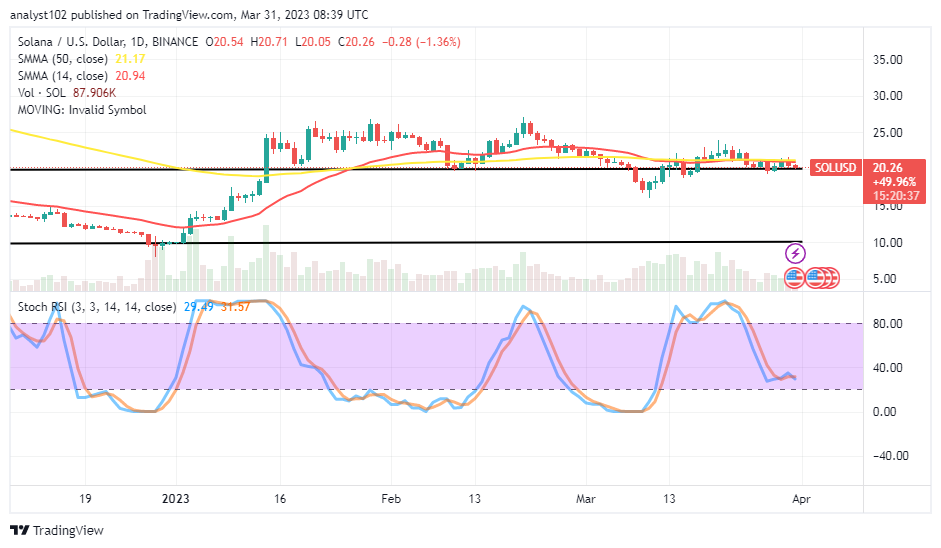
SOL/USD – Daily Chart
The SOL/USD daily chart, as of the time of this technical projection, depicts that the crypto market continues to hover around the $20 psychological upper range line of the $10 lower value over a long session. The 14-day SMA trend line is at $20.94, underneath the $21.17 value line of the 50-day SMA trend line. The Stochastic Oscillators are between 20 and 40 levels, trying to cross their lines to the southbound. That shows bears may exert more forces toward affirming a consolidation-moving mode for a while.
Is it technically inclined to instantly follow a declining move toward the SOL/USD trade at $20 at this capacity point?
Partially psychologically, it will be okay to follow a move if timely observed an active motion before it reaches the $20 line as the crypto market has continued to hover around the value line. When trading on long-term, buyers looking to open long positions look for a complementing reading agreement, which denotes a move back to the upside.
On the downside of the technical analysis, the SOL/USD market sellers have to consolidate their presence beneath the points of the SMAs in the long-term run. However, the moment a bullish candlestick emerges with a noticeable attempt by the Stochastic Oscillators trying to cross back northbound. In the meantime, bears may not push headlong underneath the $20 upper range level before running back into a bouncing mode afterward.
SOL/BTC Price Analysis
In comparison, Solana still appears to succumb to a declining trend, pairing with the purchasing power of Bitcoin. The crypto pair market continues to hover around a lower-trading spot of the SMA trend lines. The 14-day SMA indicator has a space to trend underneath the 50-day SMA indicator above the current formation of candlesticks. The Stochastic Oscillators have traversed northbound from an oversold region to 36.59 and 41.31 levels. They are trying to cross back southbound at those points, indicating that the level of basement capacity is higher.
Note: Cryptosignals.org is not a financial advisor. Do your research before investing your funds in any financial asset or presented product or event. We are not responsible for your investing results.
You can purchase Lucky Block here. Buy LBLOCK