Litecoin (LTC/USD) Market Features Rejections at $60
Estimated Reading Time: 3 minutes
Don’t invest unless you’re prepared to lose all the money you invest. This is a high-risk investment and you are unlikely to be protected if something goes wrong. Take 2 minutes to learn more

Free Crypto Signals Channel
Litecoin Price Prediction – August 1
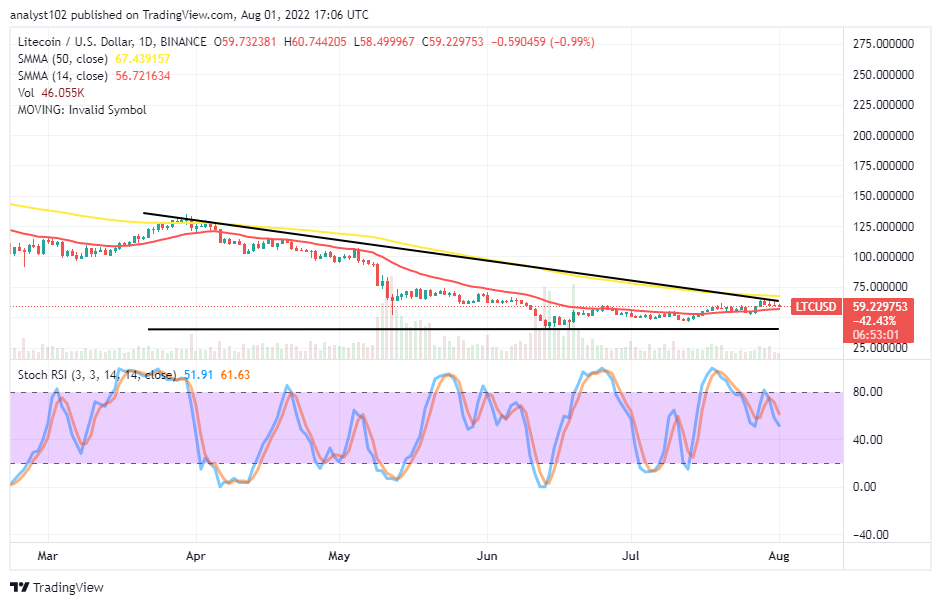
The current trading situation portends bulls have exhausted their energy in the LTC/USD trade as the crypto market features a series of price rejections at $60. The current trading line reveals price is at $59 at a minute negative percentage of 0.99.
LTC/USD Market
Key Levels:
Resistance levels: $70, $80, $90
Support levels: $50, $40, $30
LTC/USD – Daily Chart
The LTC/USD daily chart shows the crypto-economic market features a series of trade rejections at $60 underneath the trend line of the bigger SMA. The 14-day SMA indicator is around the $57 level below the 50-day SMA indicator, which is around the $67 point. The horizontal line drew to show the baseline at $40, from which upward moves have been in the past. The Stochastic Oscillators have crossed southbound, touching a range zone around 55. There may be a long-hold of positions around the 14-day SMA trend line to make decisions indefinable for traders.
Will the LTC/USD market lose momentum below the 50-day SMA at $67?
From the technical angle of view, the LTC/USD market may lose momentum underneath the 50-day SMA at the $67 level. The volatility index to the downside tends not to come forth with aggressive measures. Therefore, long-position takers will have to move southward to allow the price to rebuild its stance at a lower-trading spot below the trend line of the 14-day SMA. Buyers need to exercise a lot of patience.
On the downside of the technical analysis, as there has been a series of price rejections below the 50-day SMA indicator, short-position players seem to have a higher degree of gaining the market advantage soon to push the valuation northward further. No matter what can be the outcome of the presumed downward motion, the price may only approach the $40 baseline afterward.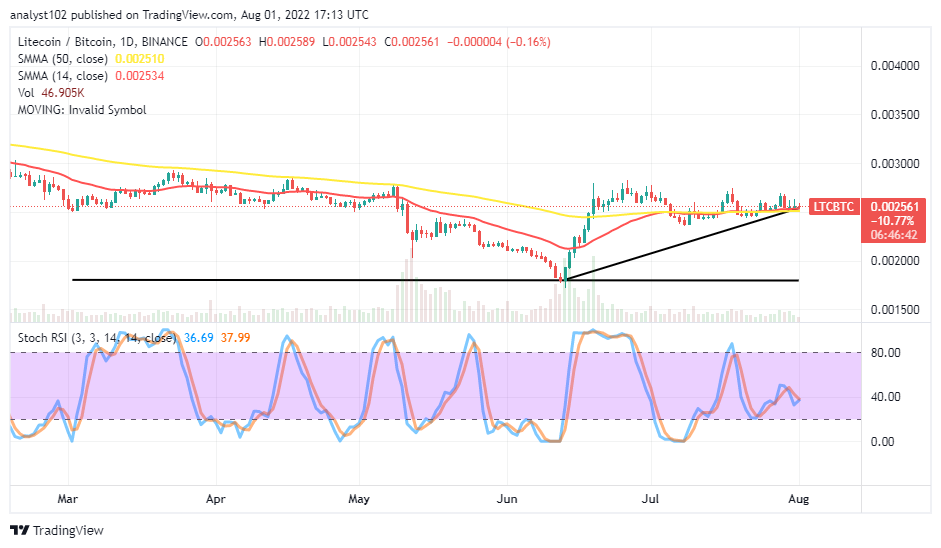
LTC/BTC Price Analysis
Ln comparison, Litecoin concurrently holds its stance firmly against the trending capability of Bitcoin. The cryptocurrency pair market features a series of rejections at a higher-resistance spot over the trend lines of the SMAs. The bullish trend line is underneath the trend lines of the SMAs. The Stochastic Oscillators have slantingly positioned northbound between the 20 and 40 ranges to signify the base crypto may not go down as it is pairing with the flagship counter-trading crypto.
Note: Cryptosignals.org is not a financial advisor. Do your research before investing your funds in any financial asset or presented product or event. We are not responsible for your investing results.
You can purchase Lucky Block here. Buy LBLOCK