Polygon (MATIC/USD) Market Falls Back into $1 and $0.70 Ranges
Estimated Reading Time: 3 minutes
Don’t invest unless you’re prepared to lose all the money you invest. This is a high-risk investment and you are unlikely to be protected if something goes wrong. Take 2 minutes to learn more
Polygon Price Prediction – November 13
The advert’s negative effect on the MATIC/USD trade operations has made the trading outlook that the crypto market falls back into the $1 and $0.70 ranges. At an average negative percentage rate of 5.01, the price is trading around the $0.891 value line.
MATIC/USD Market
Key Levels
Resistance levels: $1, $1.10, 41.20
Support levels: $0.70, $0.60, $0.50
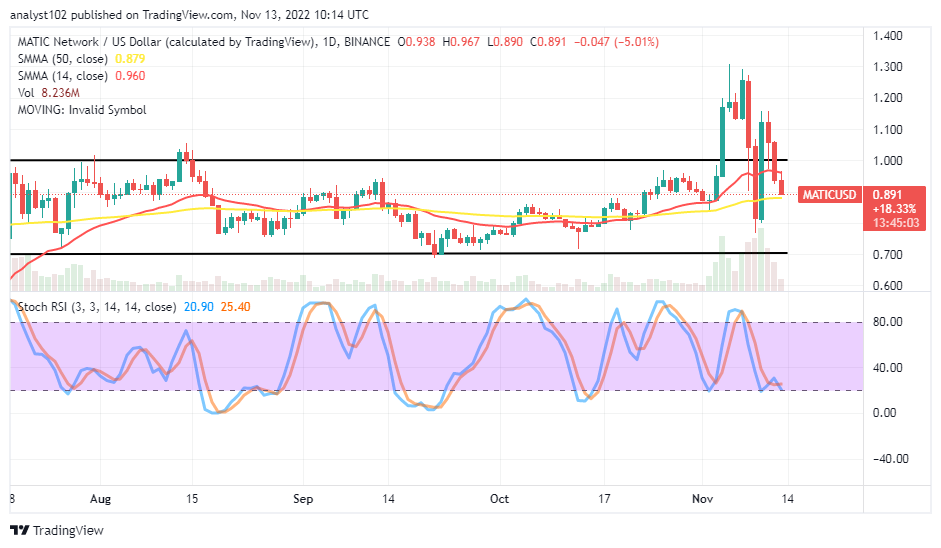
MATIC/USD – Daily Chart
The MATIC/USD daily chart reveals the crypto market falls back into the range-bound spots of $1 and $0.70 after trying to surge past the higher point for the second time during the 10th day’s trading session before returning to a declining motion in the subsequent day. The 14-day SMA indicator is at $0.960 above the $0.879 value line of the 50-day SMA indicator. And they are within the confinement of the two horizontal lines drawn at the $1 and the $0.70 range points. The Stochastic oscillators are at 25.40 and 20.90 levels, seeming to imbibe a shortline of consolidation-moving style to denote that a falling force is somewhat ongoing.Will the MATIC/USD trade decrease to the lower range zone at $0.70?
It couldn’t be a situation realizable myth that the MATIC/USD will decline to the lower-trading zone around $0.70 in the near time as the crypto market falls back into the range-bound spots of $1 and $0.70. Going by the reading posture of the Stochastic Oscillators, buyers are on the verge of reclaiming stances the moment the price aims to test support around the $0.80 line. Some lows may feature in smaller forms in the following sessions to denote the possibility of letting long-position placers obtain decent entries.
On the downside of the technical analysis, the gravitational force weight in the MATIC/USD market operations is in the mode of a gradual systemic pulling down. And such a situation can lead to a retracting moment against a smooth declining trend in no time. Short-position takers would, therefore, have to be wary of executing new shorting orders alongside the ongoing southward forces. However, investors may believe it is technically optimal to add to their portfolios, considering the current trading point.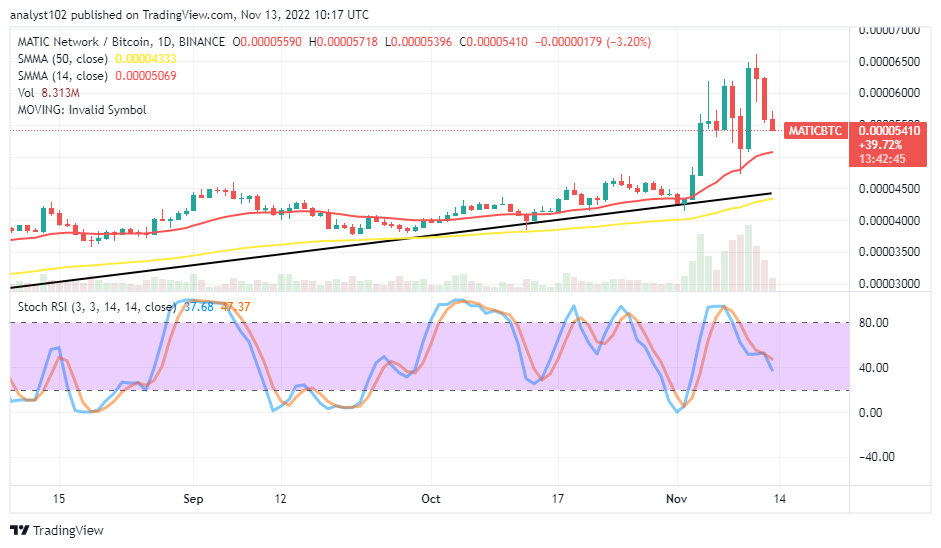 MATIC/BTC Price Analysis
In comparison, though the pairing crypto market falls back closely toward the SMA trend lines, Polygon’s trending ability outlook remains on the buy signal side of the indicators. Variant trading candlesticks have formed in a convergence manner over the 14-day SMA, which is over the 50-day SMA. The Stochastic Oscillators have traveled southward to position around 47.37 and 37.68 levels. With the decreasing emerging-trading outlook, a bearish candlestick shows MATIC is debasing, pairing with BTC.
Note: Cryptosignals.org is not a financial advisor. Do your research before investing your funds in any financial asset or presented product or event. We are not responsible for your investing results.
You can purchase Lucky Block here. Buy LBLOCK