Solana (SOL) Price Prediction: BTC/USDT Sees a Strong Downward Rejection
Estimated Reading Time: 3 minutes
Don’t invest unless you’re prepared to lose all the money you invest. This is a high-risk investment and you are unlikely to be protected if something goes wrong. Take 2 minutes to learn more

Solana (SOL) Price Prediction: August 9
The SOL/USDT daily market started seeing some upward recovery from the recent steep downward correction that occurred across the crypto market. However a downward rejection took effect as soon as the market poked through the $160.00 price level.
SOL/USDT Long-term Trend: Bullish (Daily Chart)
Key Price Levels:
Resistance Levels: $160, $180, and $200
Support Levels: $150, $140, and $130
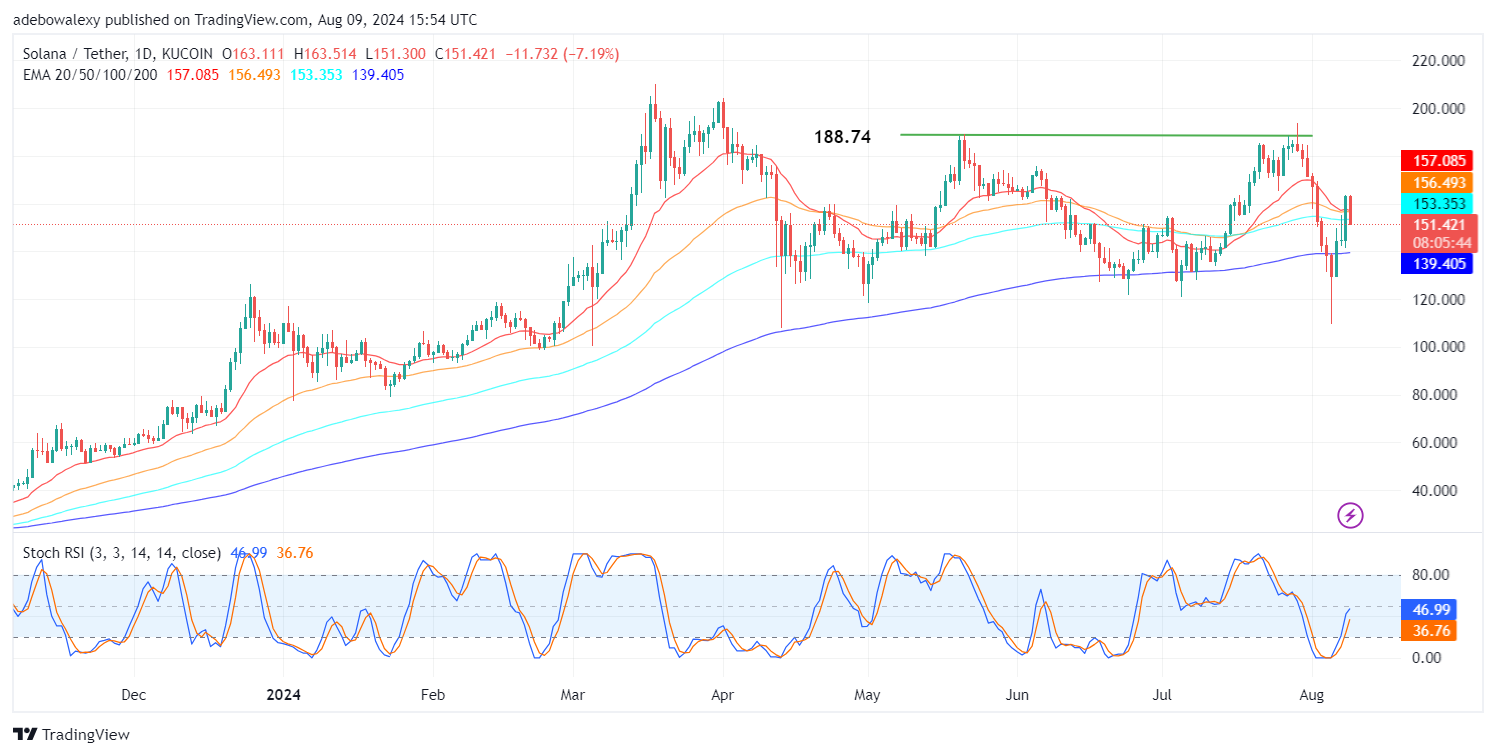
Trading activity in the Solana daily market witnessed a considerable price reduction, as evidenced by the appearance of the last price candle on the chart. Meanwhile he previous session had been significantly bullish, as it propelled the market past the $160 mark. Be that as it may, the SOL/USDT market now trades only above the 200-day Exponential Moving Average (EMA) curve. At the same time, the Stochastic Relative Strength Index (SRSI) lines maintain a general upward trajectory despite the downward correction.
Solana Price Prediction: SOL/USDT Maintains a Brave Stance
Considering the magnitude of the price decline in the Solana daily market, it appears that the market is only maintaining a brave appearance. Currently, price action is trailing below most of the EMA curves. The recent price candles show the token’s price only remaining above the 200-day EMA line.
The fact that the market is now below most of the EMA lines constitutes a bearish tone. Meanwhile, the SRSI indicator lines show only a mild deflection on their leading line, which suggests that the market is poised to descend lower despite its brave stance.
Solana Price Prediction: The SOL/USDT Market Is At Risk of Steeper Price Declines (4H Chart)
In the Solana 4-hour market, we can see that the ongoing session has placed the market below all the EMA indicator lines. This continues to work against bullish expectations, as such a display suggests that the market may fall lower. Additionally, the SRSI indicator lines are falling helplessly into the oversold region.
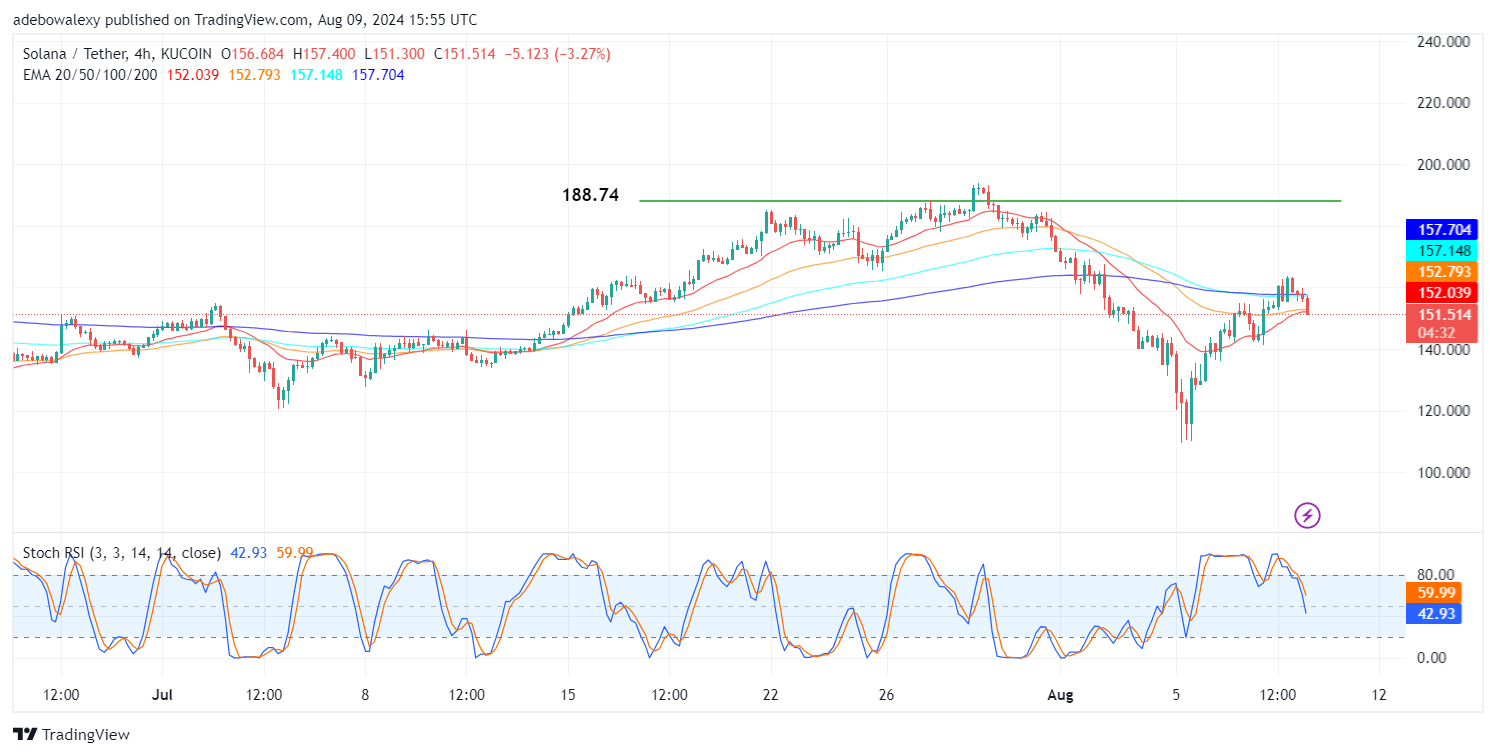
Technically, price indicators are aligned to predict that the market will descend lower. The fact that Solana now trades below all the EMA lines suggests that the headwind is gaining momentum. The trajectory of the SRSI indicator curves also aligns with the EMA, hinting that prices may descend further, perhaps towards the $150.00 mark.