Hyperliquid (HYPE/USDT) Approaches Strong Resistance: What’s Next?
Estimated Reading Time: 3 minutes
Don’t invest unless you’re prepared to lose all the money you invest. This is a high-risk investment and you are unlikely to be protected if something goes wrong. Take 2 minutes to learn more

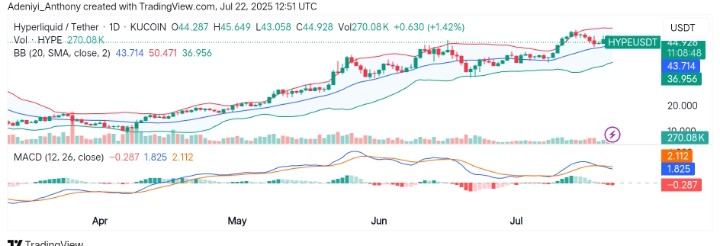
For months, Hyperliquid against the Tether has been on a steady bullish run, breaking out above its Bollinger Band midline in May. However, the price has seen strong upward momentum, pushing close to the upper Bollinger Band several times.
Currently, the price is up by 1.42% today, showing signs of fresh buying interest as it proceeds towards $46.00. However, at the moment, volume is healthy at 270K, and recent price compression near resistance suggests a potential breakout or short-term pullback.
To this end, Hyperliquid trades at $44.93, as traders await a breakout to either side.
Technical Indicators
Major Resistance Levels: $46.20, $50.47, and $55.00
Major Support Levels: $43.71, $41.00, and $36.95
Hyperliquid Technical Analysis
The technical analysis of Hyperliquid against Tether shows that the price operates at the upper section of the Bollinger Bands, indicating overextension, but remains bullish as it continues to ride above the 20-day moving average (SMA).
However, the MACD line (blue) is slightly below the signal line (orange), with a negative histogram, indicating a short-term weakening in momentum as the gap narrows.
Though the volume appears to be increasing, supporting the bullish structure. However, a break below $43.70 may push the price towards $41.00 in the near term before another major move. Conversely, if the price can break above the current resistance, a move towards $46.20 would be noticed soon.
HYPE/USDT Analysis: Expectations
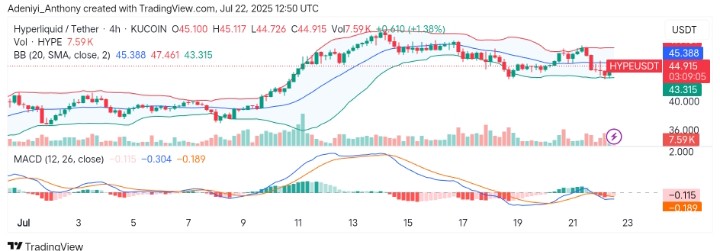
On the 4H chart, HYPEUSDT is consolidating just below key resistance at $45.38, failing to break above the upper Bollinger Band. However, the price recently bounced near the lower Bollinger Band at $43.31, indicating short-term demand with a relatively low volume.
Beneath the chart, the MACD is below the signal line, signaling weak momentum but flattening, hinting at a possible reversal. To this end, the price action suggests a breakout in either direction. However, a break above $45.40 with increased volume could increase the chances of a bullish move. Conversely, failure to hold above $43.30 could trigger a test of deeper support.
You can purchase crypto coins here. Buy LBlock


