Hyperliquid (HYPE/USDT) Slows Down as Momentum Builds Above Key Support Zones
Estimated Reading Time: 3 minutes
Don’t invest unless you’re prepared to lose all the money you invest. This is a high-risk investment and you are unlikely to be protected if something goes wrong. Take 2 minutes to learn more

The market for Hyperliquid against the Tether has remained strongly bullish, settling above the ribbon of the Guppy Multiple Moving Averages (GMMA). Though the price recently broke above multiple short-term resistance levels, it is now consolidating near $47, holding above all key support levels.
As it stands, current price action still confirms that bulls are still active. However, the Stochastic RSI appears bent to the south but in the overbought region, reflecting that the price may be experiencing a slight pullback.
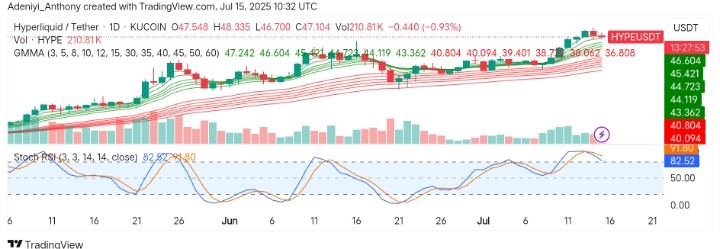
Currently, Hyperliquid trades at $47.104 with over 210k traded volume for the day.
Technical Indicators
Major Resistance Levels: $48.33, $50.00, and $52.20
Major Support Levels: $46.60, $45.42, and $43.36
Hyperliquid Technical Analysis
On a daily timeframe, Hyperliquid against the Tether appears to be ranging above at a new height with a fully fanned-out GMMA as the price consistently rides above the green fast-band cluster. This pattern signals a healthy uptrend supported by strong internal momentum. However, the Stochastic RSI is currently aiming towards the 70-mark level, suggesting a pullback scenario might likely play out if buyers refuse to build on the current structure.
To this end, if the price holds above $46.60, the pair could see further upward movement in the short term, but a slight pullback or sideways move could occur before another leg up if the support fails.
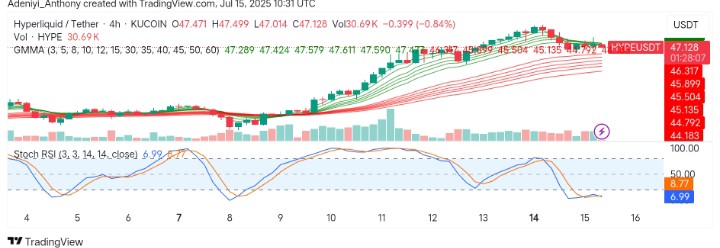
HYPE/USDT Analysis: What’s Next?
On the 4H chart, HYPE/USDT still possesses a bullish structure but appears to be cooling momentum. However, the price has pulled back slightly from the $47.50 zone, sitting on Guppy fast support.
From another angle, the volume is thinning, showing indecision among buyers and sellers at this level. However, the Stochastic RSI is in the oversold region, signaling a possible bounce or reversal if volume becomes bullish.
To this end, the support in this timeframe is at $45.90, and a necessary margin to maintain a bullish structure still exists. However, a break below this level could lead to the pair breaking another support; conversely, a bounce here could lead to a retest of $48.00, confirming continuation from the daily breakout.
You can purchase crypto coins here. Buy LBlock