SPONGE/USD ($SPONGE) Market Outlook: Bullish Undercurrents as May Begins
Estimated Reading Time: 3 minutes
Don’t invest unless you’re prepared to lose all the money you invest. This is a high-risk investment and you are unlikely to be protected if something goes wrong. Take 2 minutes to learn more

As May begins, the SPONGE/USD market remains firmly anchored near the $0.0001 level, indicating a persistent bullish defense of this critical support zone. This ongoing price stability lowers the likelihood of a breakdown. Notably, the series of horizontal candlesticks observed on the daily chart—though mostly doji patterns—are predominantly green, which signals subtle bullish interest. This may suggest that accumulation is quietly taking place beneath the surface, as traders position themselves for a potential breakout toward higher price levels.
The convergence of solid support and growing market activity at the start of the new month could serve as a catalyst for an upward move—especially if bullish momentum begins to gather strength.
Key Levels to Watch
- Resistance: $0.000110, $0.000120, $0.000130
- Support: $0.000090, $0.000085, $0.000080
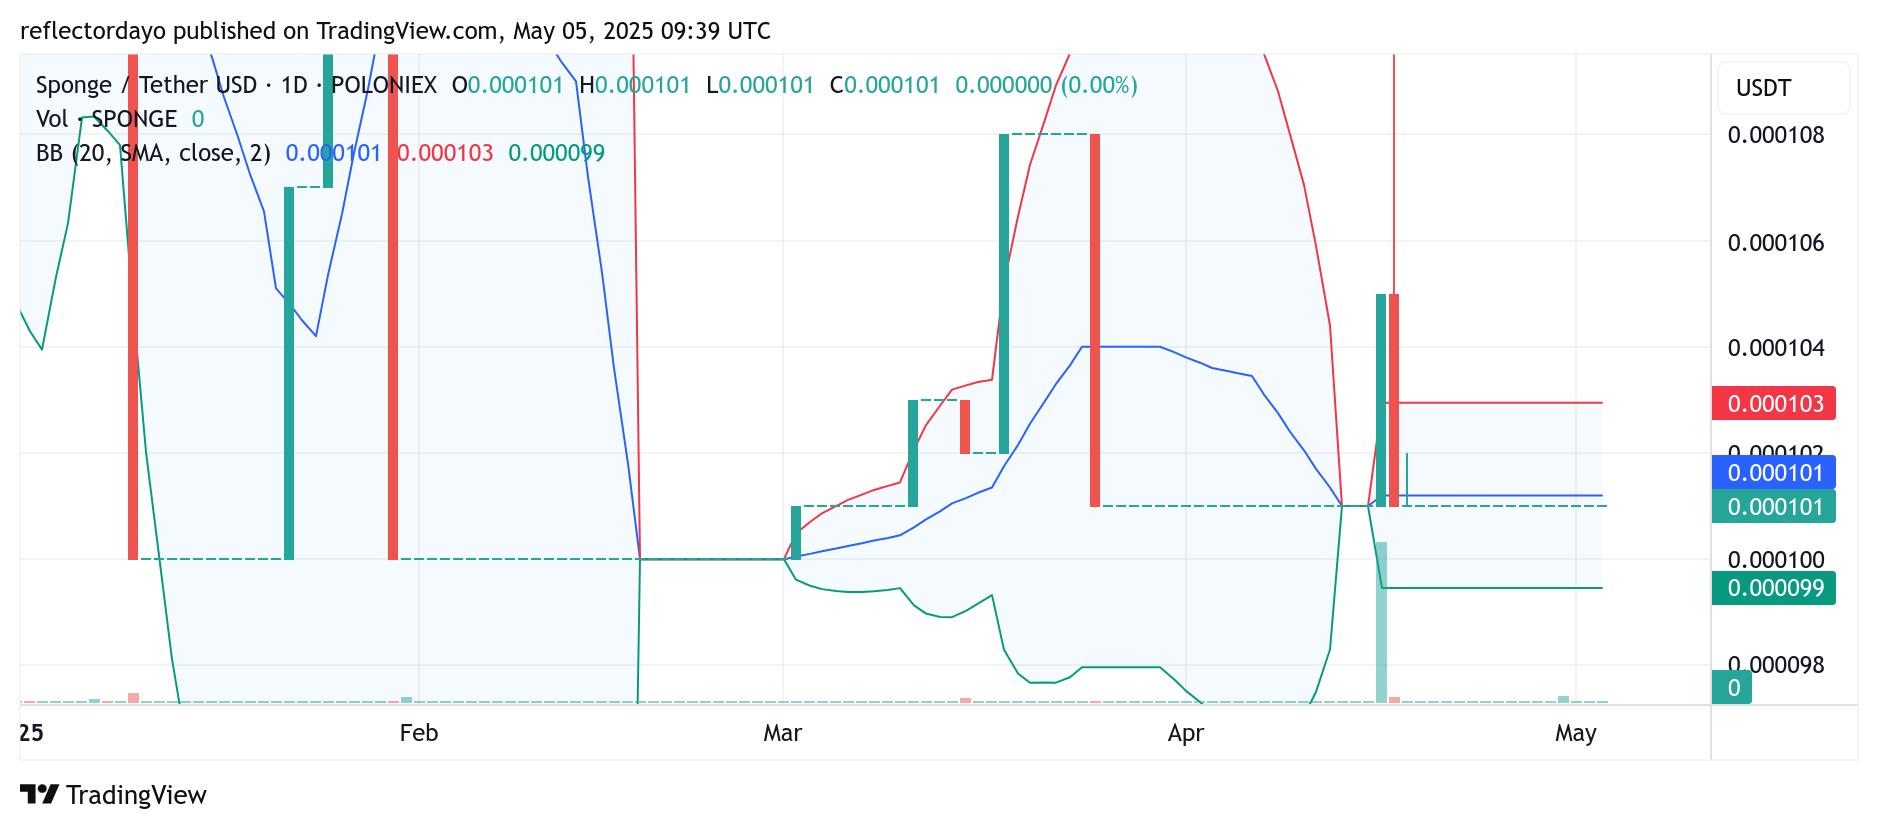
SPONGE/USD Daily Chart: Early Buying Interest Signals Potential Upside
A closer look at the SPONGE/USD daily chart reveals signs of accumulation, suggesting that bearish pressure is weakening. Following an extended period of sideways movement, the market seems poised for a bullish breakout. Typically, when there is a prolonged balance between buyers and sellers around a key support level—such as the $0.0001 zone—bearish momentum tends to diminish, making it increasingly difficult for sellers to drive the price lower.
This kind of setup often precedes an upward move. For a sustained rally throughout May, SPONGE must establish a higher support base that can act as a launchpad into a more favorable trading range. Failing to do so could result in the price retreating once again to test the $0.0001 level. However, current indications suggest that the next likely market direction is upward—making this a potentially opportune moment for bullish entries.
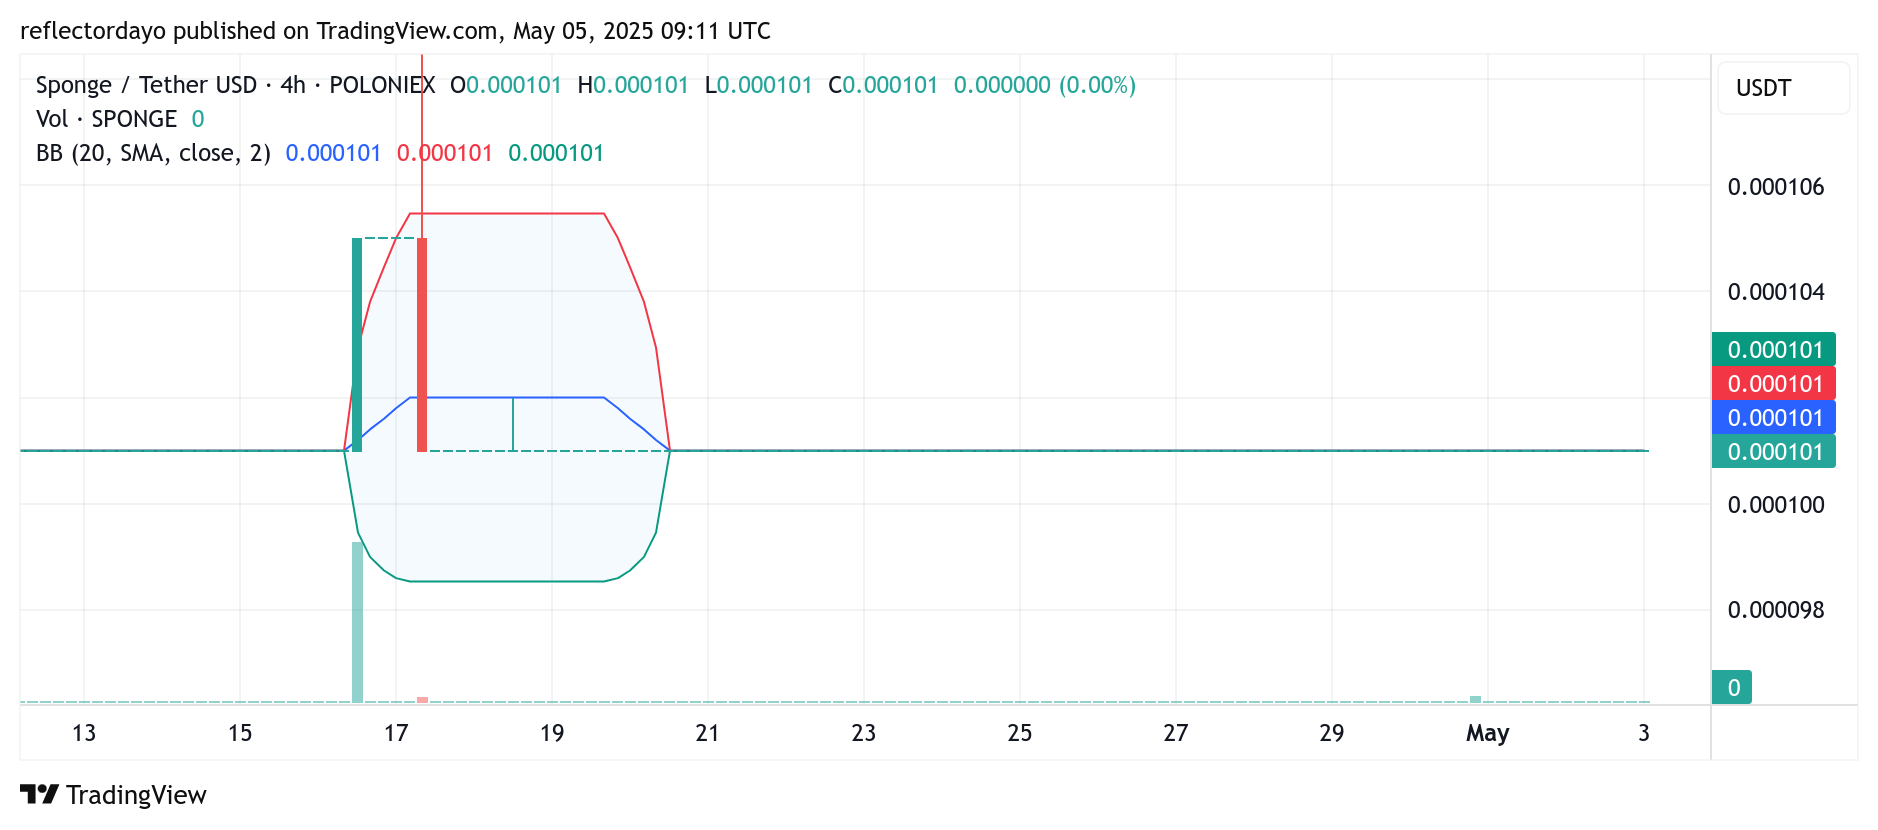
SPONGE/USD 4-Hour Chart: Tightening Range May Precede Breakout
On the 4-hour timeframe, SPONGE/USD is exhibiting signs of volatility compression, with price action tightening within a narrowing range. This classic setup often precedes a breakout in either direction—though current indicators are leaning slightly bullish. While overall trading volume has remained relatively flat for some time, this doesn’t necessarily rule out a move. It’s possible that a few strong hands have been quietly accumulating positions, potentially setting the stage for a larger market move that could attract broader participation.
If upward momentum builds, traders should watch the $0.00011 level as the next key target in the short term. Should the bullish run continue beyond that, the market could extend its gains toward the $0.00012 zone and beyond.
Buy $SPONGE!
HODLING through the noise pic.twitter.com/g7fN7pKX0l
— $SPONGE (@spongeoneth) April 28, 2025
Join the SPONGE community and get in on the next big crypto opportunity! Buy Sponge ($SPONGE) today