Ethereum Resumes Its Ascent as It Targets the $2,000 High
Estimated Reading Time: 2 minutes
Don’t invest unless you’re prepared to lose all the money you invest. This is a high-risk investment and you are unlikely to be protected if something goes wrong. Take 2 minutes to learn more
Ethereum Price Long-Term Analysis: Bullish
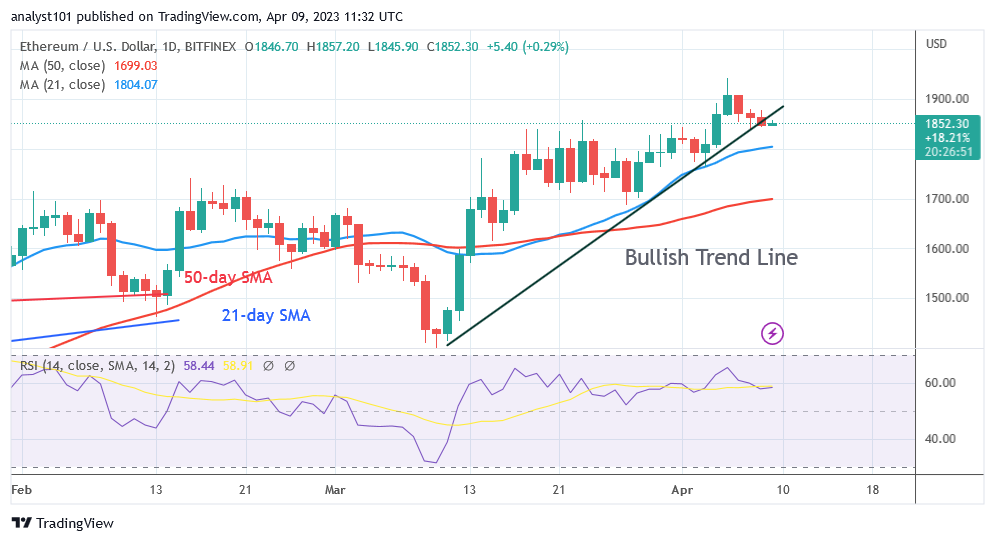
The price of Ethereum (ETH) finds support above $1,844 as it targets the $2,000 high. Ether will be pushed by buyers to retest or break through the $1,900 resistance level. The psychological price level of $2,000 for Ether will be reached if the current resistance is broken and the bullish momentum is maintained. Over the $2,000 high, the bullish trend will gain more momentum. Before its regression, Ether’s price action had reached a high of $1,943 earlier. Today, as Ether declined to the low of $1,844 and pulled back, the bulls protected the current support level at $1,850. Ether has started moving up again and has regained bullish momentum.
Ethereum Indicator Analysis
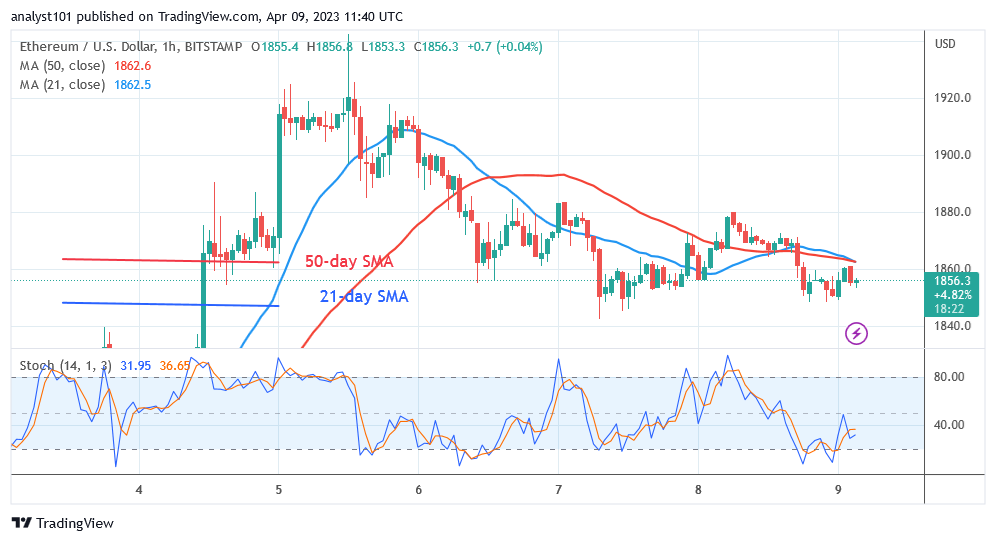
Ether has a Relative Strength Index score of 58 for period 14. Ether is still in the bullish trend zone, and it may rise even higher to reach its previous highs. After the recent decline, the price bars are above the moving average, indicating a further upward movement. Below the 40-point threshold of the daily Stochastic, the bears’ downward momentum has stalled.
Technical indicators:
Major Resistance Levels – $2, 600, $2,800, $3,000
Major Support Levels – $1.600, $1, 400, $1,200
What Is the Next Direction for Ethereum?
It is no longer bearish because the cryptocurrency’s value has dropped as it targets the $2,000 high. The most valuable altcoin dropped but later climbed above the $1,850 level. It is anticipated that Ether will rise once more. However, the biggest altcoin is only trading marginally as a result of the Doji Candlesticks.
You can buy crypto coins here. Buy LBLOCK
Note: Cryptosignals.org is not a financial advisor. Do your research before investing your funds in any financial asset or presented product or event. We are not responsible for your investing results