Polkadot Upward Correction Faces another Rejection at $7.46
Estimated Reading Time: 2 minutes
Don’t invest unless you’re prepared to lose all the money you invest. This is a high-risk investment and you are unlikely to be protected if something goes wrong. Take 2 minutes to learn more

Free Crypto Signals Channel
Polkadot (DOT) Long-Term Analysis: Bearish
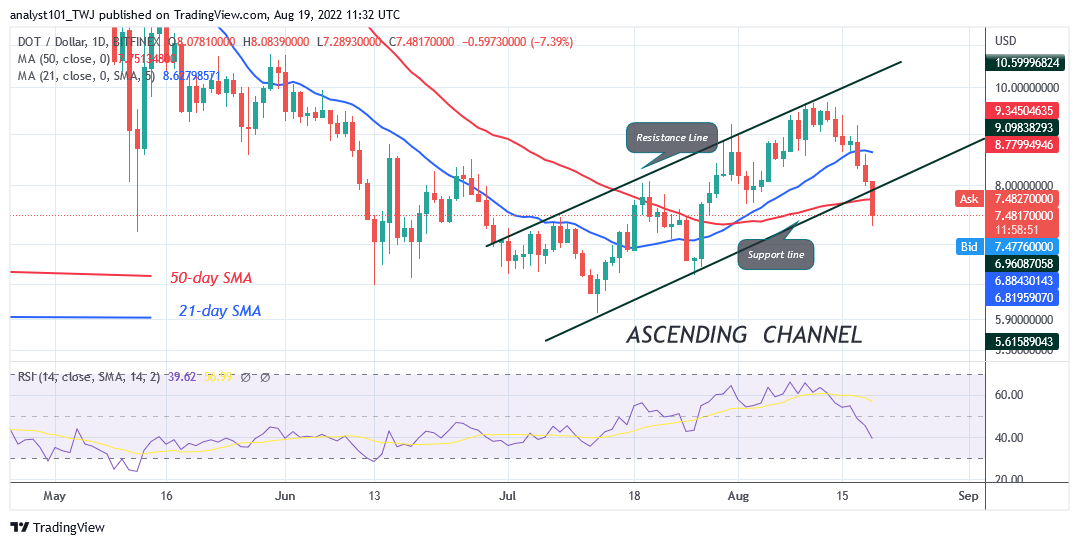
On August 19. Polkadot’s (DOT) price plunged to the low of $7.23 as it faces another rejection at $7.46. For the past 24 hours, the decline has subsided as the altcoin resumes upward. The current decline was buyers’ failure to keep the price above the $9.68 overhead resistance. Today, the bears have pushed the altcoin to the low of $7.23. The coin has declined to an oversold region of the market. The current decline is likely to subside as it holds above the current support. However, if the bears break below the current support, DOT price will further decline to the previous lows at $6.52 and $5.98 price levels.
Polkadot (DOT) Indicator Analysis
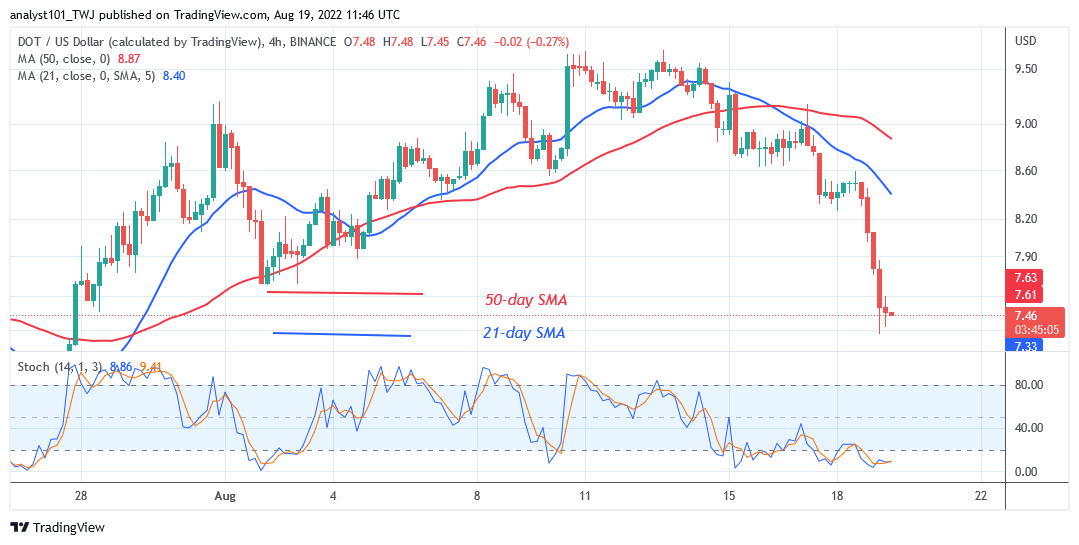
The cryptocurrency is at level 40 of the Relative Strength Index for period 14. DOT price is in the bearish trend zone and may further decline. The crypto’s price is below the moving average lines which indicates further selling pressure. The altcoin price is below the 20% range of the daily stochastic. Polkadot is in the oversold region of the market. The current selling pressure may subside.
Technical indicators:
Major Resistance Levels – $10, $12, $14
Major Support Levels – $8, $6, $4
What Is the Next Direction for Polkadot (DOT)?
On the 4 – hour chart, Polkadot is holding above the current support as it faces another rejection at $7.45. The time has reached for buyers to emerge in the oversold region of the market.
You can purchase crypto coins here. Buy LBLOCK
Note: Cryptosignals.org is not a 1a financial advisor. Do your research before investing your funds in any financial asset or presented product or event. We are not responsible for your investing results