Bitcoin (BTC) Price Prediction: BTC/USDT Retreats to Hover Around $115,000
Estimated Reading Time: 3 minutes
Don’t invest unless you’re prepared to lose all the money you invest. This is a high-risk investment and you are unlikely to be protected if something goes wrong. Take 2 minutes to learn more

Date: August 6, 2025
The Bitcoin market has, for a while, lost its support at the $120,000 price level. It subsequently retreated and now hovers just above the $114,000 price region.
BTC/USDT Long-Term Trend — Bullish (Daily Chart)
Key Price Levels:
Resistance: $115,000, $117,500, $120,000
Support: $114,000, $111,500, $109,000
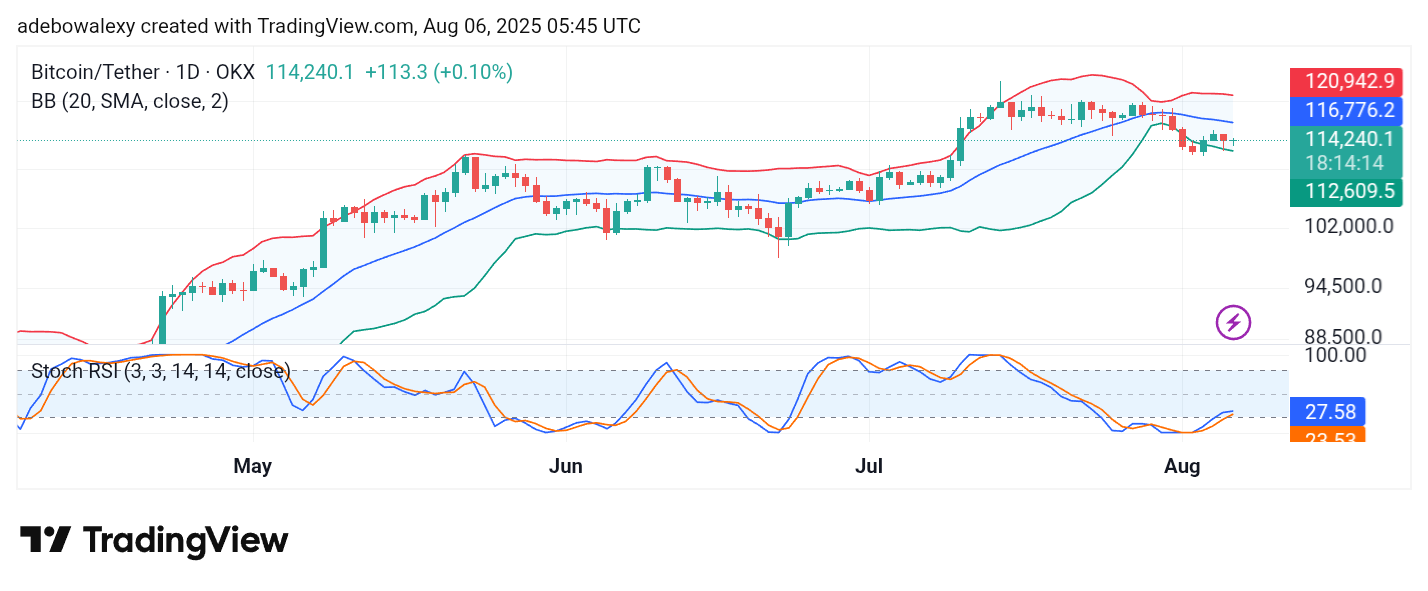
Recent price candles on the Bitcoin daily chart can be seen forming just above the lower band of the Bollinger Bands (BB) indicator. The current session’s candle appears red with a very small body, positioned below the midline of the BB indicator. Additionally, the BB indicator itself is beginning to slope slightly downward.
Meanwhile, the Smoothed Relative Strength Index (SRSI) lines have taken on a subtly upward curve, suggesting an early sign of possible bullish recovery.
Bitcoin Price Prediction: BTC/USDT Bulls Have a Shaky Footing
The signals from the Bitcoin daily chart are not strongly bullish. Technical indicators suggest that the market currently lacks a solid catalyst to trigger a meaningful upward move.
As price action continues to hover near the lower band of the BB indicator, the BB lines are also slanting downward, implying increasing downward pressure. While this could be temporary, the SRSI lines are also beginning to converge toward a bearish crossover, though they remain in the oversold region. This may point to an ongoing weakness in the short term.
Bitcoin Price Prediction: BTC/USDT Bullish Sentiment Faces a Challenge (4-Hour Chart)
On the 4-hour chart, Bitcoin appears to be testing a resistance barrier. The latest price candle is green (bullish) and is currently testing the midline of the Bollinger Bands.
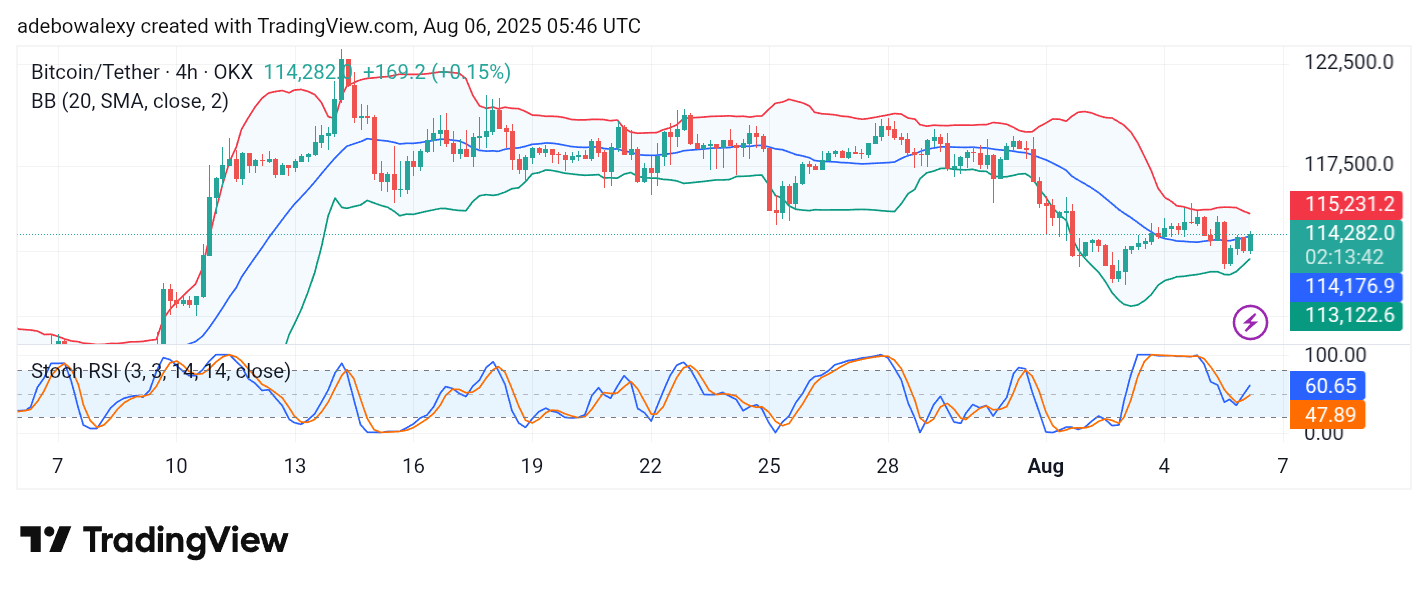
This keeps BTC trading just above that central band. The BB indicator is also narrowing slightly, with a subtle upward slope, suggesting potential consolidation before a breakout.
Meanwhile, the SRSI indicator has just formed a bullish crossover below the 50 level. The leading line is now above 60, with both lines remaining under the 70 mark. This setup suggests that there may be short-term bullish opportunities, potentially leading the price toward the $116,000 or $117,500 resistance levels.