Lucky Block Price Prediction: LBLOCK/USD Ranges for More Buyers to Surface
Estimated Reading Time: 3 minutes
Don’t invest unless you’re prepared to lose all the money you invest. This is a high-risk investment and you are unlikely to be protected if something goes wrong. Take 2 minutes to learn more

Free Crypto Signals Channel
The Lucky Block price prediction would begin to form higher as the coin prepares to follow the bullish movement.
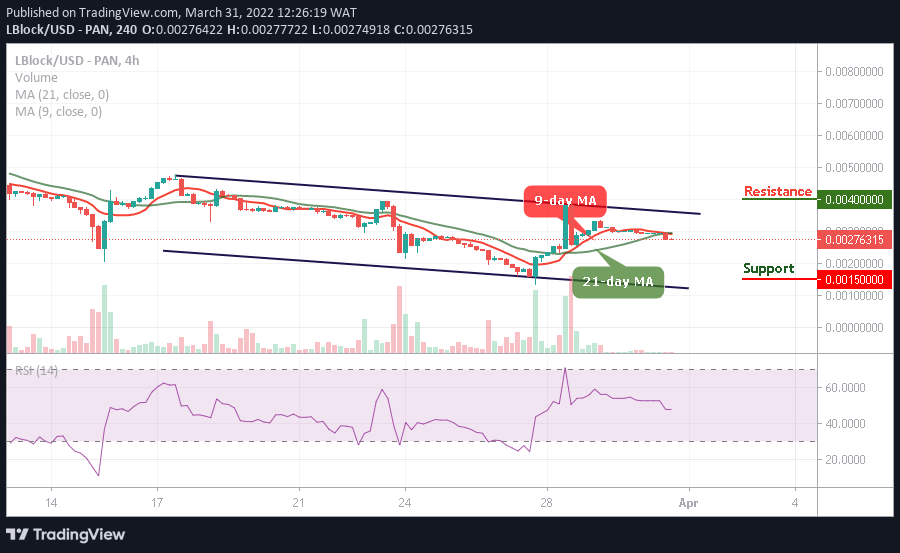
LBLOCK/USD Medium-term Trend: Ranging (4H Chart)
Key Levels:
Resistance levels: $0.0040, $0.0045, $0.0050
Support levels: $0.0015, $0.0010, $0.0005
LBLOCK/USD is trading below the 9-day and 21-day moving averages. The bulls are pushing the coin towards the resistance level of $0.0030 to gain access to the upside. However, the Lucky Block price may retreat a little but it is to allow more buyers to come into the market.
Lucky Block Price Prediction: LBLOCK/USD Would Spike to the Upside
The Lucky Block price would break above the 9-day and 21-day moving averages as soon as the bulls defend the $0.0030 level. Meanwhile, any further bullish movement towards the upper boundary of the channel may push the coin to the potential resistance levels of $0.0040, $0.0045, and $0.0050.
For now, this technical analysis may not play out now if the bears remain below the moving averages and fall to the support levels of $0.0015, $0.0010, and $0.0005. Moreover, the technical indicator Relative Strength Index (14) is moving below 50-level to prepare the coin for the bullish movement in the next positive direction.
LBLOCK/USD Medium-term Trend: Ranging (2H Chart)
When compared to the 2-hour chart, the Lucky Block price would move up higher as it is ready to cross above the 9-day and 21-day moving averages. However, the long-term moving averages may keep the bullish movement as the market prepares for a new trend.
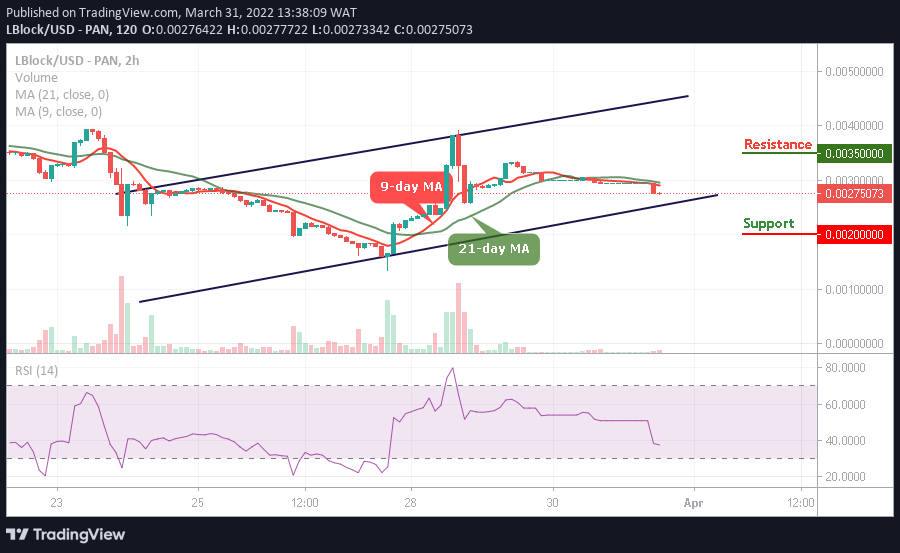
Nonetheless, if the buyers push the price above the moving averages; higher resistance could be reached at $0.0035 and above. The technical indicator Relative Strength Index (14) remains below the 40-level and should the bulls fail to move the current market value up, the bears may step into the market, and the nearest support level could be located at $0.0020 and below.
Read more: