Polkadot (DOT/USDT) Shows Bullish Sign After Recent Decline Below Key Support Levels
Estimated Reading Time: 3 minutes
Don’t invest unless you’re prepared to lose all the money you invest. This is a high-risk investment and you are unlikely to be protected if something goes wrong. Take 2 minutes to learn more
The market for Polkadot against Tether over the last 24 hours has gained 5.5%, reaching $2.25. This performance appears to be better than the 2.31% rise across the crypto market.
As it stands, this rally was fueled by several factors, with Bitwise ETF inclusion and the technical breakout, as seen in the bullish MACD, prominent among them. Also, expectations of a Fed rate are driving optimism.
Currently, Polkadot trades at $2.220 with more than 1.22 million daily traded volumes.
Technical Indicators
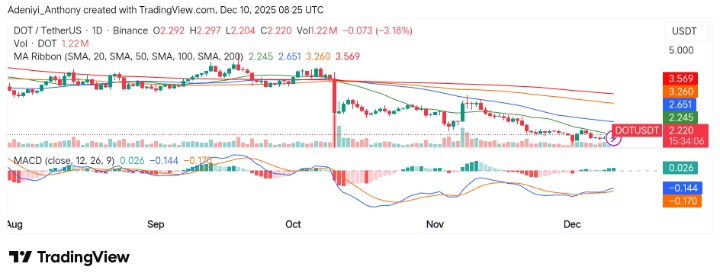
Major Resistance Levels: $2.651, $3.260, and $3.569
Major Support Levels: $2.190, $2.100, and $2.050
Technical Analysis
Technically, Polkadot against Tether appears bearish with a significant drop below the 50-day moving average (blue line). This is especially visible in the large red candles and the trend of the moving averages, showing that the market is under pressure.
As it stands, the price recently tested and failed to maintain above the $2.245 support level, hinting that the pair wanted a breakout but met with strong resistance.
On the other hand, the MACD is currently showing a positive divergence with a bullish histogram. This is reinforcing the fact that a bullish momentum is building.
In the short term, the focus will likely be on whether DOTUSDT can hold the $2.220 level. A drop below this support could drive the price lower, testing $2.160 or potentially lower levels.
#dot/usdt
Polkadot is breaking above a falling wedge formation on the daily timeframe
This breakout and the MA 50 could trigger upward movement toward $8.00🎯👇Crypto Traders-join Telegram👇 https://t.co/oRAVD0i3ly
. pic.twitter.com/EsDEGP8WE7— Whales_Crypto_Trading 🐋 (@WHALES_CRYPTOt) December 9, 2025
Meanwhile, @Whales_cryptot has suggested that Polkadot is showing signs of a potential breakout from a falling wedge formation, and the $8.00 level might be the target. The analyst opined that if the price can stabilize above the 50-day moving average, a major development to the upside may start to unfold.
DOT/USDT Analysis: Showing Potential Reversal Signal as Price Finds Support
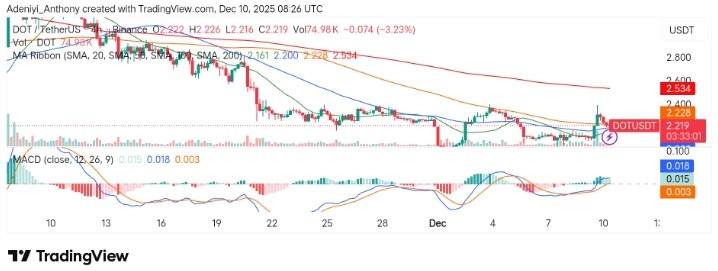
Looking at the 4-hour chart, DOTUSDT is showing some positive signs, with a slight recovery around the $2.200 support. The price is consolidating and appears to be holding steady near this level. As it stands, if the price manages to stay above this support, there could be a chance of testing the $2.230 resistance level in the near future.
However, the chart still shows caution, as the MACD appears to be giving a signal of a drop in buying volume, and the price movements are relatively range-bound. This suggests that there might be limited upside potential until a solid break above the next resistance levels is witnessed.
You can purchase crypto coins here. Buy Crypto