Polkadot (DOT/USDT) Shows Signs of Potential Recovery After Extended Downtrend
Estimated Reading Time: 3 minutes
Don’t invest unless you’re prepared to lose all the money you invest. This is a high-risk investment and you are unlikely to be protected if something goes wrong. Take 2 minutes to learn more
Polkadot against Tether in the last 24 hours has surged by 11.98%, performing better than the 6.85% rally in the crypto market. This noticeable change came briefly after the 1st of December, a 11.4% decline that led to a drop in value to $2.05. As it stands, the recent rebound is largely attributed to technical factors, as the assets signal a natural correction to the top after recording an oversold condition.
Additionally, market sentiment appears to be tilting favorably as the crypto greed and fear index shifted from an extreme level to a mild level, reflecting a broader recovery coupled with the anticipation of upgrades to the ecosystem in December.
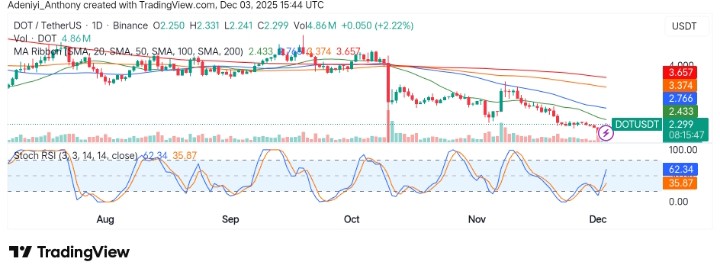
Currently, Polkadot trades at $2.299 with more than 4.86 million traded volumes for the day.
Technical Indicators
Major Resistance Levels: $2.299, $2.477, and $2.700
Major Support Levels: $2.244, $2.200, and $1.950
Technical Analysis
Technically, the market for Polkadot against Tether is currently forming a bullish setup, bouncing off the immediate support level as the Stochastic RSI signals increasing strength. Meanwhile, the chart setup with respect to the moving average ribbon shows a bearish bias, but the noticeable increase in volume supports the possibility of bullish continuation.
To this end, a sustained move above $2.433 with increasing volume would suggest a continued uptrend; otherwise, a drop below $2.200 could suggest a continuation of the previous trend.
Today’s Update on Polkadot
Polkadot has been under pressure prior to this time, trending downward with several failed attempts at sustaining a move to a new lower height. However, at the current position, the token appears to be cushioned by many support lines, raising the hope of seeing another upside, but a stretch below $2.80 in recent times has reduced the likelihood of such a move.
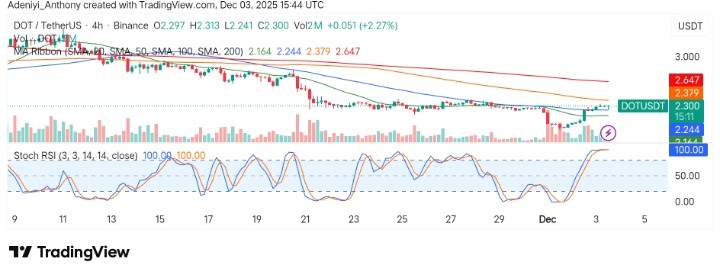
DOT/USDT Analysis: Showing Clear Upside Signals
On the 4-hour chart, DOT/USDT is showing a clear upward signal after testing the support level at $2.244. Apparently, the price is consolidating with an overbought condition from the Stochastic RSI around $2.299. This could suggest a strong uptrend or a fall from the current value if momentum falls.
To this end, a move above the immediate resistance would signal a clear move to the north; otherwise, a fall below $2.244 could signal a potential pullback.
You can purchase crypto coins here. Buy Crypto