Polkadot (DOT/USDT) Faces Bearish Momentum as Prices Struggle Below Resistance
Estimated Reading Time: 3 minutes
Don’t invest unless you’re prepared to lose all the money you invest. This is a high-risk investment and you are unlikely to be protected if something goes wrong. Take 2 minutes to learn more
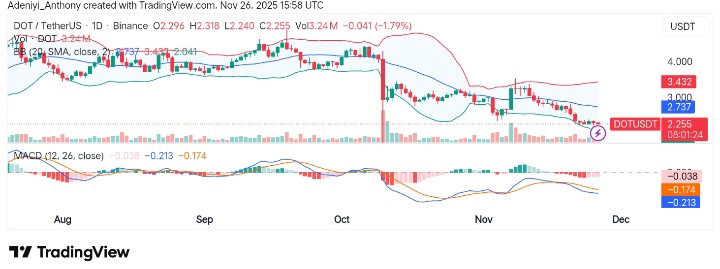
The market for Polkadot against Tether in recent times has been dominated by bearish activities, as displayed on the daily chart. The chart visualized price actions that have pierced through the support zone despite all bullish efforts at strategic points.
However, actions on the 24-hour timeframe in the last four days show the price has remained stalled on a spot above $2.20, looking like the pair has bottomed and is waiting for a confirmation to the north. Meanwhile, as it stands, the Bollinger and MACD suggest the direction may be towards $2.73 with increasing momentum.
Currently, Polkadot trades at $2.254 with more than 3.24 million traded volumes on the daily chart.
Technical Indicators
Major Resistance Levels: $2.737, $3.431, and $4.000
Major Support Levels: $2.250, $2.000, and $1.900
Technical Analysis
On the daily timeframe, Polkadot against Tether has been moving lower within a descending trend, bouncing off resistance around $3.000 before stabilizing above $2.042. However, the MACD is displaying bearish divergence as the indicators suggest increasing bearish momentum. To this end, if the price fails to break above the 20-period moving average, a move below the lower band may materialize.
$DOT already gave us a chance to catch that correlation move, exactly as expected. Now the correction on the lower timeframe looks completed.
I’m looking for a modest ~15% bounce followed by a consolidation phase, as long as the current pattern doesn’t break.#Trading https://t.co/uEAZAIsMoP pic.twitter.com/xLNM7Z3NIs
— Timmi Arno (@timmi_arno) November 26, 2025
Additionally, @Timmi_arno has discussed the recent DOT price movement and its current pattern in a tweet on X (formerly Twitter). The analyst is of the opinion that the token will rise by 15% before another consolidation phase, as long as the current price pattern is maintained.
DOT/USDT Analysis: Facing Falling Momentum
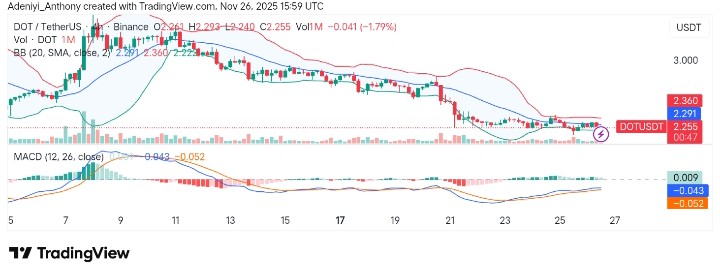
On the 4H chart, DOT/USDT continues to face difficulty breaking above $2.366 resistance, and as it stands, the pair appears to be consolidating around the 20-period moving average within tight Bollinger Bands.
From another angle, the MACD histogram shows a declining momentum, with the fast line remaining below the slow line. However, slight recovery signals appear, showing a potential for a short-term reversal if there is bullish volume support.
You can purchase crypto coins here. Buy Crypto