Polkadot (DOT/USDT) Faces Pressure While Testing Critical Support Levels
Estimated Reading Time: 3 minutes
Don’t invest unless you’re prepared to lose all the money you invest. This is a high-risk investment and you are unlikely to be protected if something goes wrong. Take 2 minutes to learn more
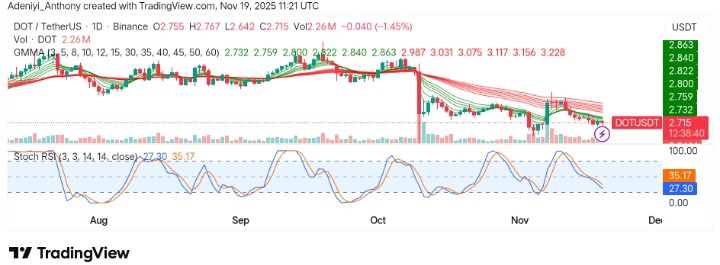
The market for Polkadot against Tether has dropped 1.45% to $2.70 over the last 24 hours. The decline is primarily due to a technical breakdown, with Polkadot falling below a critical support level of $2.94. At the moment, this technical weakness has raised concerns among investors, particularly as the asset struggles to maintain its recent momentum.
Meanwhile, Polkadot is also dealing with post-upgrade uncertainty following infrastructure changes made during the Nov 3-5 network migration. To this end, these updates have led to some ambiguity in the project’s short-term outlook, further exacerbating investor caution. The DOT/USDT chart for the daily timeframe shows that the price of Polkadot has been experiencing a steady downtrend, with key support levels under pressure. Currently, Polkadot trades at $2.715 with 2.26 million traded volumes for the day.
Technical Indicators
Major Resistance Levels: $2.820, $2.860, and $2.900
Major Support Levels: $2.600, $2.400, and $2.000
Technical Analysis
Technically, the overall trend of Polkadot against Tether on the daily chart is bearish. The price appears to be testing important support at $2.70.
Meanwhile, the stochastic RSI shows that DOT is in the oversold zone (26.89), suggesting the possibility of a short-term price rebound. As it stands, bearish momentum still remains dominant, as seen in the bearish stance presented by the Guppy Multiple Moving Averages (GMMA), with the shorter-term moving averages positioned well below the longer ones, reinforcing the downtrend. To this end, if $2.700 breaks a test of $2,600 on my surface.
Today’s Polkadot Update
In the last ten days, Polkadot has made it towards critical support at $2.260, and at the moment, signs of bullishness are yet to surface. However, an internal bounce appears to be unfolding as the price approaches its first micro-resistance area between $3.12 and $4.21.
To this end, a break above the upper limit of my spark renewed bullish interest.
DOT/USDT Analysis: Displaying Potential for Further Downside
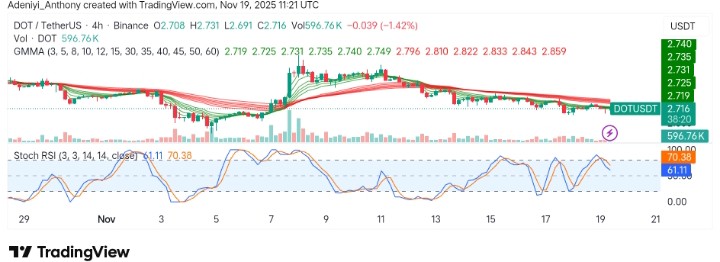
On the 4-hour chart, DOT/USDT appears to be experiencing a minor rebound after reaching oversold conditions, but the trend is still struggling to gain substantial upward momentum. A break above resistance could signal a short-term bullish reversal.
Meanwhile, the stochastic RSI on the 4-hour chart shows a similar situation, with the price oscillating in the oversold zone but pushing toward a potential recovery. The major support at $2.70 is still holding strong, but price action might try to extend to the south as the indicator points to the south. To this end, the price needs to break above $2.750 for a corrective move; otherwise, a continuation of the current trend may be seen.
You can purchase crypto coins here. Buy Crypto