Bancor (BNTUSD) Breakout on the Horizon
Estimated Reading Time: 2 minutes
Don’t invest unless you’re prepared to lose all the money you invest. This is a high-risk investment and you are unlikely to be protected if something goes wrong. Take 2 minutes to learn more
Bancor Gear up for Breakout – Analysis
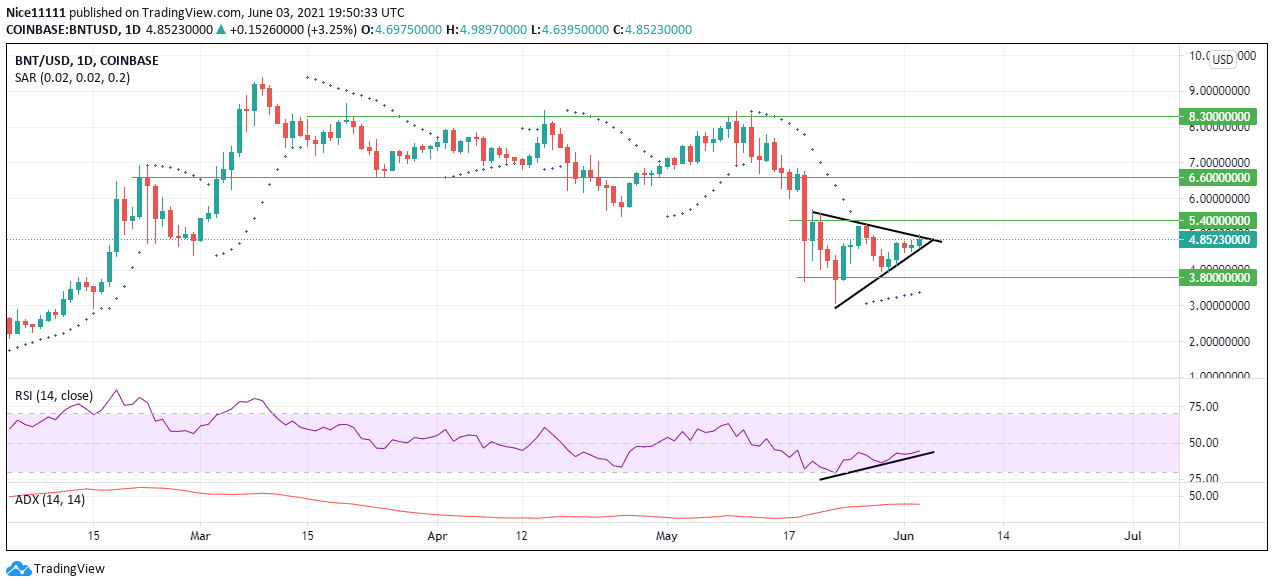
The market is seen to have formed lower highs over the past fourteen trading days. The recent high was formed on the 26th of May 2021 at a resistance zone of $5.400. The market has concurrently formed higher lows, and the most recent higher low was formed on the 29th of May 2021 on a support level at $3.800. The lower highs and higher lows in the market have converged on the daily chart to form a symmetrical triangle. The symmetrical triangle would certainly lead to a breakout on Bancor.

BNTUSD Significant Zones
Support Zones: $3.800 $6.600
Resistance Zones: $5.400 $8.300
What to Expect as Bancor Breakout
The symmetrical triangle could either break higher or break lower. The Relative Strength Index is at 44.53 at the point of writing. This mark below 50 shows the market bearishness. The indicator’s line has risen higher towards the upside which means that the market is about to resume buying.
The Average Directional Index shows 36.58 to signify that the bearish trend is already weak and exhausted. The Parabolic SAR (Stop and Reverse) indicator has posted eight points below the candlesticks to give a clear alert on the initiation of buying in the market.
On the four-hour chart, the symmetrical triangle is very prominent. The Parabolic SAR points act as support for price bullishness.
The beak higher would lead to the resistance zone at $5.400. The market is likely to retest the downward trending triangle border after the breakout.
Note: new.cryptosignals.org is not a financial advisor. Do your research before investing your funds in any financial asset or presented product or event. We are not responsible for your investing results.