Polkadot (DOT/USDT) Surges Over 2%: Bulls Eyeing $3.45 Resistance After Breakout
Estimated Reading Time: 3 minutes
Don’t invest unless you’re prepared to lose all the money you invest. This is a high-risk investment and you are unlikely to be protected if something goes wrong. Take 2 minutes to learn more
The market for Polkadot against Tether in the 24-hour chart is off to an impressive start, recording gains after the previous day’s dip in value. However, it appears the pair is still down by 1.19% compared with last day’s closing price. As it stands, the reason for the margin can be attributed to parachain migration and token unlocks, which have led to increased supply pressure.
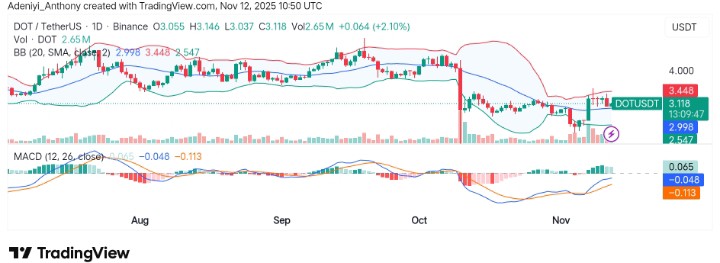
Currently, Polkadot trades at $3.118 with 2.19% daily gains, but the current candle appears to be overshadowed by the previous bearish candle as the struggle between the bulls and bears continues.
Technical Indicators
Major Resistance Levels: $3.200, $3.400, and $4.000
Major Support Levels: $3.000, $2.900, and $2.800
Technical Analysis
Technically, Polkadot against Tether appears to be improving, recovering previous losses, but engulfed by the previous activities as depicted by the candle preceding the candle, which suggests a noticeable bearish impact in the market. However, the immediate micro resistance appears to be around $3.200, a break above this level as the Bollinger Bands expand would suggest a move towards $4.000 in the coming session.
Meanwhile, caution may be necessary due to the movement of the MACD’s histogram, which displays bullish pressure gradually waning. To this end, a break below $2.990 or $3.000 would suggest a halt to the current bounce.
Polkadot’s Update
Analysis from the previous trading session shows that Polkadot has seen its value depleted to $2.26 and $2.30. However, on the daily timeframe, the token movement suggests a potential to the upside, but a bounce from the current position must be seen. Meanwhile, on the smaller timeframe, the coin has a small space to the upside, but definitely, there might be an upside.
DOT/USDT Analysis: Can Momentum Be Maintained?
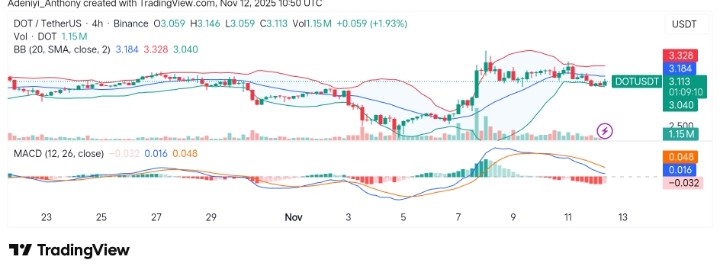
On the 4H chart, DOT/USDT appears to be aiming at the $3.180 dynamic resistance level and engulfing the previous bar. However, the expansion of the Bollinger bands suggests there are no elaborate activities in this timeframe.
On the other hand, the MACD suggests that the bearish impact on the market seems to be going down, but more is needed by the bulls to push the price towards $3.32.
Overall, while DOT is currently rangebound and needs to close above $3.180 to signal a confirmed bullish move, traders should closely watch technical signals for a breakout or corrective action. Maintaining momentum will depend on the market breaking key resistance levels in the sessions ahead, making this a crucial time for Polkadot’s price direction.
You can purchase crypto coins here. Buy Crypto