Solana (SOL/USD) Price Keeps Upswings, Averaging $100
Don’t invest unless you’re prepared to lose all the money you invest. This is a high-risk investment and you are unlikely to be protected if something goes wrong. Take 2 minutes to learn more

Solana Price Prediction – January 26
A crypto signal has staged in a positive format, as the current financial report indicates that the SOL/USD market’s price keeps upswings, averaging the point of $100.
After fostering the notion of resilient uprising forces, long-position players would need to make sure that the $80 baseline bargaining climate is not violently reversed to the south. Buyers would need to maintain a fearfully optimistic and stable position through the middle Bollinger Band’s apparent strengthening line.
SOL/USD Market
Key Levels:.
Resistance levels: $100, $110, $120
Support levels: $80, $75, $70
SOL/USD – Daily Chart
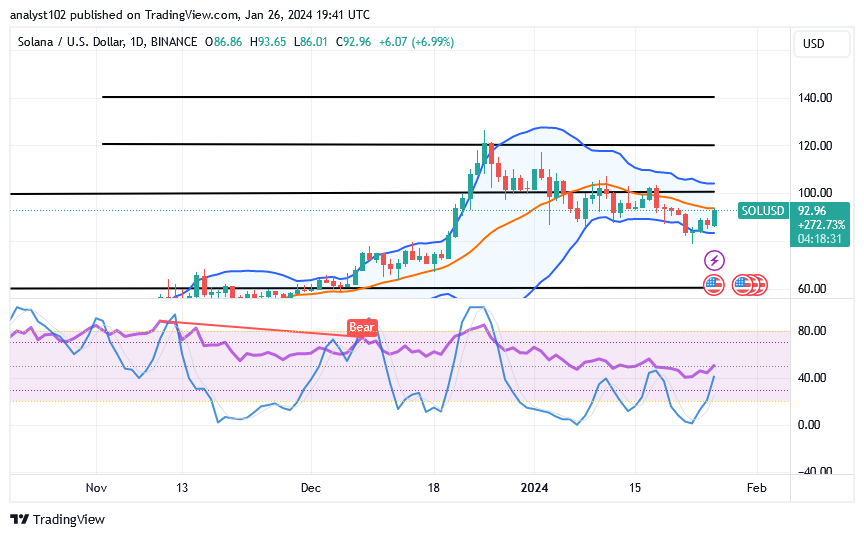
The SOL/USD daily chart reveals that the cryptocurrency keeps upswings, averaging the overhead trade barrier of $100.
The stochastic oscillators are in a mode of trying to move firmly northwardly away from the spot of 40. The trending styles of the Bollinger Bands are positioned systemically to the south with a pattern to showcase that bullish flag to formulate formidable best crypto signals in the indicators and boundaries.
Is it now technically ideal for buyers to pull out from around the line of the lower Bollinger Band of the SOL/USD market?
It is currently becoming a stable situation for long-position takers to stage back variant longing positions around the lower path of the lower Bollinger Band, given that the SOL/USD market keeps upswings, averaging the point of $100.
It is anticipated that the buyers entered the market when a bullish impulse signal started to emerge from below the lower Bollinger Band around four days ago. If the price is unable to tremblingly push higher to the upside, a pit stop is likely to occur near the middle Bollinger Band in the interim.
A production line of price movements is visible in the intermediate and upper Bollinger bands. After observing conditions indicating that the stochastic oscillators will be inclined to curve back south, it appears to be perfect for bears to rest their entries at a certain coupling with an active decreasing pressure.
SOL/BTC Price Analysis
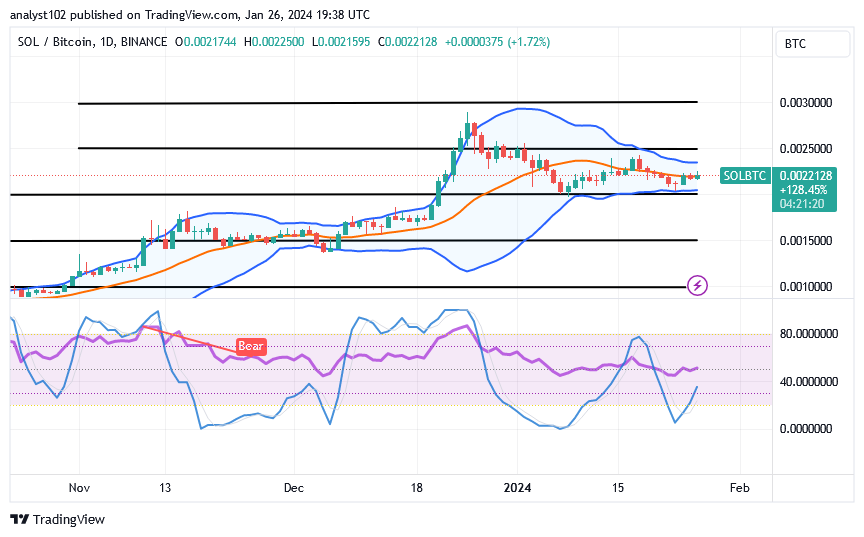
In contrast, Solana’s price keeps upswings versus the trending weight of Bitcoin, averaging the upper Bollinger Band trend line.
The blue line for the stochastic oscillators has curved to the north, suggesting that there are forces pushing them back toward the higher levels. The Bollinger Bands are positioned to highlight various areas where the markets are going to find good entry possibilities.
Note: Cryptosignals.org is not a financial advisor. Do your research before investing your funds in any financial asset or presented product or event. We are not responsible for your investing results.
You can purchase Lucky Block here. Buy LBLOCK
