Solana (SOL/USD) Surges Above $120, Aims for Stability
Estimated Reading Time: 2 minutes
Don’t invest unless you’re prepared to lose all the money you invest. This is a high-risk investment and you are unlikely to be protected if something goes wrong. Take 2 minutes to learn more
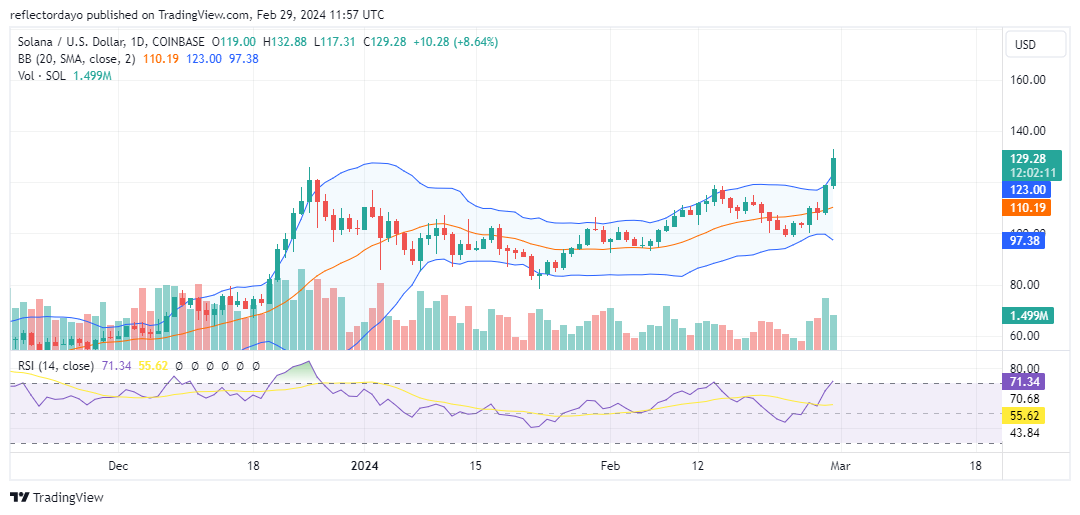
Solana faced rejection at the $120 level during the year-end rally, and the price has since struggled to breach it. Despite the overall bearish trend in the market, Solana found support around $85, likely due to the optimism fueled by the previous bullish run and the performance of other projects. Since then, the market has seen a tug-of-war between demand and supply, with the recent surge above $100 on February 24th suggesting a potential shift in momentum towards the bullish side.
Solana Market Data
- SOL/USD Price Now: $129.26
- SOL/USD Market Cap: $57 billion
- SOL/USD Circulating Supply: 442 million
- SOL/USD Total Supply: 570 million
- SOL/USD CoinMarketCap Ranking: #5
Key Levels
- Resistance: $130, $140, and $145.
- Support: $110, $100, and $95.
Solana Market Analysis: The Indicators’ Point of View
The previously strong resistance level of $100 now acting as support signifies a potential shift in market sentiment towards bullishness. The recent price surge above $120 reinforces this possibility, attracting further bullish interest while not entirely eliminating bearish sentiment. If the current trend continues, the $120 level may also convert into support, aiding a potential price climb towards the 2022 high of $140.
Breaking through the significant resistance has attracted investors, leading to increased volatility, as evidenced by the widening Bollinger Bands. While this volatility presents an opportunity for the bulls to reach $140 faster, it can also amplify potential bearish resistance.
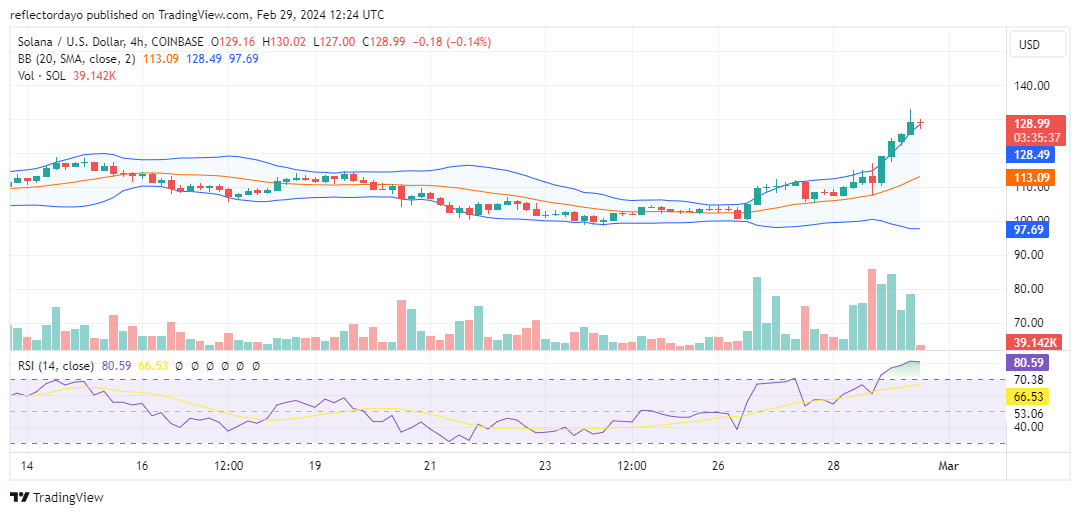
SOL/USD 4-Hour Chart Outlook
The 4-hour Solana chart indicates a surge in trading volume as the price climbs. However, the market has encountered resistance at the $130 level. This resistance is further evidenced by a sharp decline in volume during the current trading session. Due to this strong barrier, Solana may seek nearby support before retesting the $130 resistance, which, according to this crypto signal, has the potential for a breakout.