Polkadot Recovers above $4.00 and Resumes Its Bullish Ascent
Estimated Reading Time: 2 minutes
Don’t invest unless you’re prepared to lose all the money you invest. This is a high-risk investment and you are unlikely to be protected if something goes wrong. Take 2 minutes to learn more
Polkadot (DOT) Long-Term Analysis: Bearish
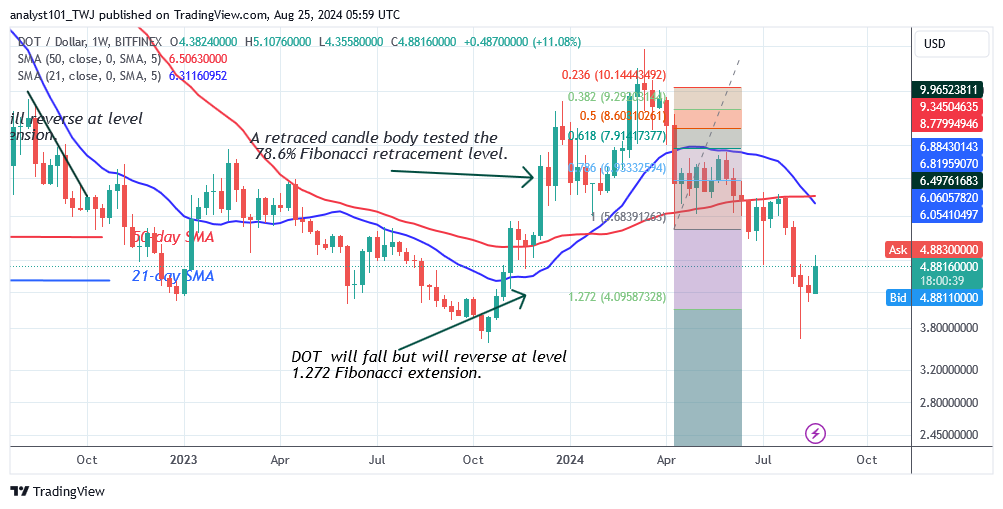
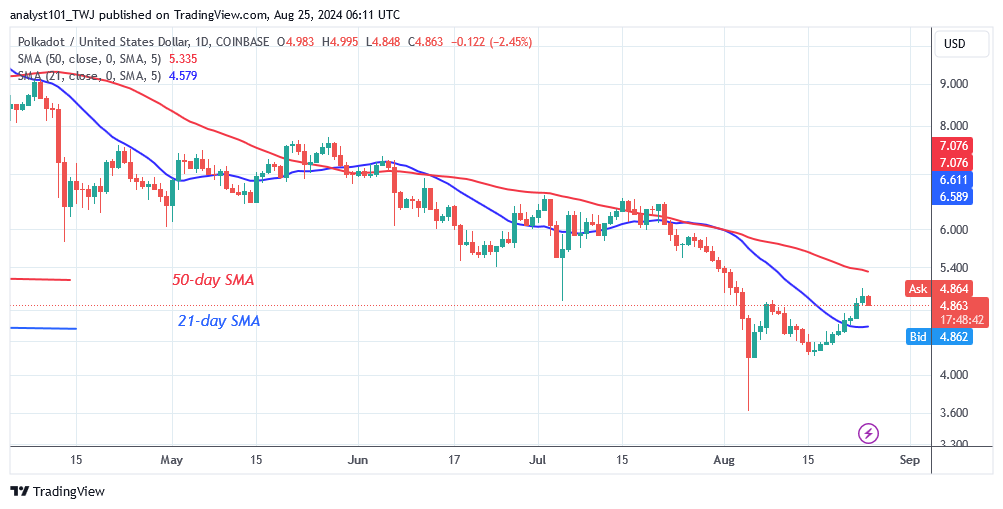
Polkadot’s (DOT) price dips to a low of $3.61 on August 5 and resumes its bullish ascent. Furthermore, the price indication suggests a probable decline and reversal above the $4.00 support. Today, the DOT price has moved above the 21-day SMA resistance, although it is facing an initial barrier. On the upside, buyers are expected to push the altcoin above the 50-day SMA, or $5.40 on the daily chart.
A break above the 50-day SMA will push the altcoin to a high of $6.50. However, the bullish momentum has been halted at the $5.10 high. Polkadot is retracing after breaking the initial barrier at $5.10. If the bears break below the 21-day SMA support, the DOT price will return to its present support level of $4.00.
Technical indicators:
Major Resistance Levels – $10, $12, $14
Major Support Levels – $8, $6, $4
Polkadot (DOT) Indicator Analysis
Following the current price rally, DOT trades above the 21-day SMA support but below the 50-day SMA resistance. If the 21-day SMA support holds, the altcoin will remain between the moving average lines for a few days. Meanwhile, the retracement has subsided above the 21-day SMA support.
What Is the Next Direction for Polkadot (DOT)?
Polkadot’s price is recovering after breaking above the 21-day SMA barrier and resuming its bullish ascent. The price signal indicates that the altcoin will resume its bullish ascent. The cryptocurrency faces early resistance at the recent high as it trades above the anticipated price range. The crypto signal is bullish as the altcoin reverses from the current trend.
You can purchase Lucky Block here. Buy LBLOCK
Note: Cryptosignals.org is not a financial advisor. Do your research before investing your funds in any financial asset or presented product or event. We are not responsible for your investing results.