SPONGE/USD ($SPONGE) Remains Strong at the $0.000100 Resistance Level
Estimated Reading Time: 3 minutes
Don’t invest unless you’re prepared to lose all the money you invest. This is a high-risk investment and you are unlikely to be protected if something goes wrong. Take 2 minutes to learn more
Since our previous analysis, the SPONGE/USD market has remained stable. Apart from the recent dip to $0.000096 and the recovery back to the crucial $0.00010 price level, which was also reflected in the last analysis, there has been nothing much. The market has held on to the crucial $0.00010 price level.
The market at the $0.000099 price level is essentially moving along the threshold of the $0.000100 price level. There is likely going to be a bullish breakout from this level. As the level has been held for quite a while as the bullish last line of defense. Therefore, the market is not likely to fall further below this level.
Key Levels
- Resistance: $0.000115, $0.000120, and $0.000125.
- Support: $0.00010, $0.000090, and $0.00008.
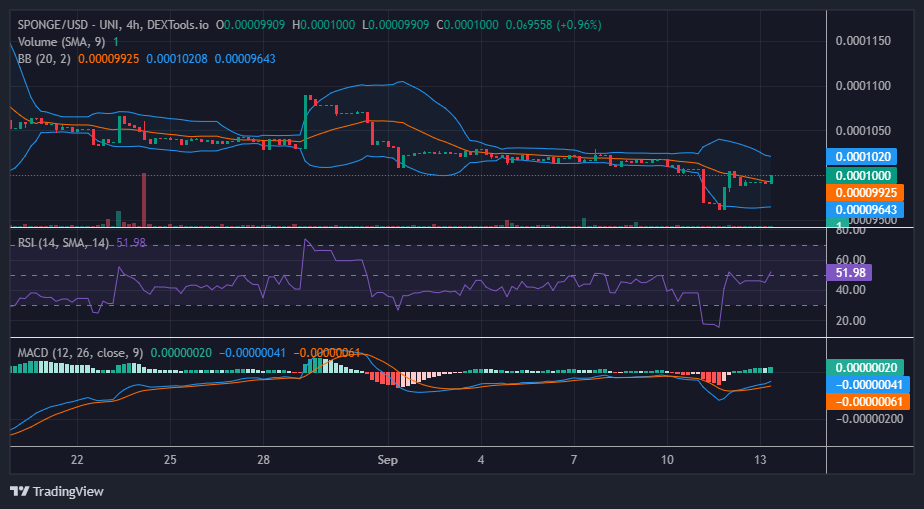
Sponge (SPONGE/USD) Price Analysis: Insights from Indicators
The technical indicators continue to depict an impressive price rally, recovering strongly after experiencing selling pressure that momentarily pushed it below a critical support level. Initially, the Bollinger Bands displayed an expanding range, with the lower standard deviation trending downward. However, as anticipated, SPONGE/USD bullish momentum emerged from beneath this crucial support, reclaiming the $0.00010 price mark and restoring market equilibrium.
The Relative Strength Index (RSI) also mirrors this market shift. The RSI exhibited a recovery from well below the overbought threshold, ascending directly to the 50 level. Drawing from historical data, this level is expected to serve as a focal point for a bullish resurgence.
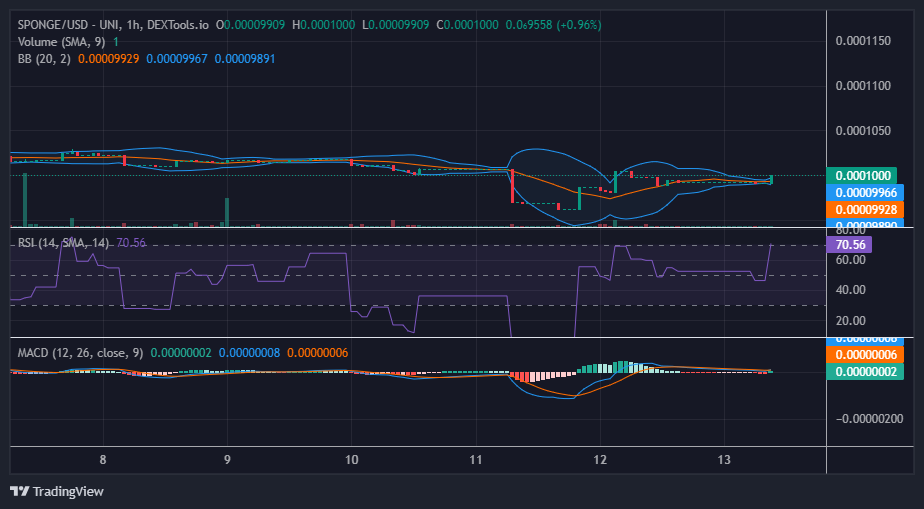
$SPONGE Short-Term Outlook: 1-Hour Chart
Looking at the 1-hour chart, we noticed the increasing convergence of the price channel, which is well portrayed by the Bollinger Bands. In the recent 1-hour chart, a strong bullish candle is emerging. However, a source of major concern is that the Bollinger Bands are not affected by this bullish move. We could hopefully expect the market to consolidate around here for a while before a bullish move ensues.
SPONGE/USD is available on Uniswap.
🧽 Take the plunge with $SPONGE and dive into the excitement! 💦
🧽 Begin trading #SPONGE on @Uniswap now! 🔄🚀💼
🧽Discover the trading journey: https://t.co/bAQyuWo66w pic.twitter.com/32zoTLeyfs
— $SPONGE (@spongeoneth) September 13, 2023
Invest in the hottest and best meme coin. Buy Sponge ($SPONGE) today!